The cluster administration overview is for anyone creating or administering a Kubernetes cluster.
It assumes some familiarity with core Kubernetes concepts.
Planning a cluster
See the guides in Setup for examples of how to plan, set up, and configure
Kubernetes clusters. The solutions listed in this article are called distros.
Note:
Not all distros are actively maintained. Choose distros which have been tested with a recent
version of Kubernetes.
Before choosing a guide, here are some considerations:
Do you want to try out Kubernetes on your computer, or do you want to build a high-availability,
multi-node cluster? Choose distros best suited for your needs.
Will you be using a hosted Kubernetes cluster, such as
Google Kubernetes Engine, or hosting your own cluster?
Will your cluster be on-premises, or in the cloud (IaaS)? Kubernetes does not directly
support hybrid clusters. Instead, you can set up multiple clusters.
If you are configuring Kubernetes on-premises, consider which
networking model fits best.
Will you be running Kubernetes on "bare metal" hardware or on virtual machines (VMs)?
Do you want to run a cluster, or do you expect to do active development of Kubernetes project code?
If the latter, choose an actively-developed distro. Some distros only use binary releases, but
offer a greater variety of choices.
Familiarize yourself with the components needed to run a cluster.
Authenticating explains authentication in
Kubernetes, including the various authentication options.
Authorization is separate from
authentication, and controls how HTTP calls are handled.
Using Admission Controllers
explains plug-ins which intercepts requests to the Kubernetes API server after authentication
and authorization.
Admission Webhook Good Practices
provides good practices and considerations when designing mutating admission
webhooks and validating admission webhooks.
In a Kubernetes cluster, a node
can be shut down in a planned graceful way or unexpectedly because of reasons such
as a power outage or something else external. A node shutdown could lead to workload
failure if the node is not drained before the shutdown. A node shutdown can be
either graceful or non-graceful.
Caution:
The unattended-upgrades package from Debian conflicts with node graceful shutdown in
its normal configuration.
If you use the default configuration of unattended-upgrades, which customizes the server shutdown
grace period, then the kubelet fails to obtain the necessary lock to handle shutdown events properly.
This happens if the shutdownGracePeriod value is greater than 30 seconds.
To avoid this, you can suppress part of the unattended-upgrades configuration,
by making /etc/systemd/logind.conf.d/unattended-upgrades-logind-maxdelay.conf be a symbolic link
to /dev/null.
The kubelet attempts to detect node system shutdown and terminates pods running on the node.
Kubelet ensures that pods follow the normal
pod termination process
during the node shutdown. During node shutdown, the kubelet does not accept new
Pods (even if those Pods are already bound to the node).
Enabling graceful node shutdown
FEATURE STATE:Kubernetes v1.21 [beta](enabled by default)
On Linux, the graceful node shutdown feature is controlled with the GracefulNodeShutdownfeature gate which is
enabled by default in 1.21.
Note:
The graceful node shutdown feature depends on systemd since it takes advantage of
systemd inhibitor locks to
delay the node shutdown with a given duration.
FEATURE STATE:Kubernetes v1.34 [beta](enabled by default)
On Windows, the graceful node shutdown feature is controlled with the WindowsGracefulNodeShutdownfeature gate
which is introduced in 1.32 as an alpha feature. In Kubernetes 1.34 the feature is Beta
and is enabled by default.
Note:
The Windows graceful node shutdown feature depends on kubelet running as a Windows service,
it will then have a registered service control handler
to delay the preshutdown event with a given duration.
Windows graceful node shutdown can not be cancelled.
If kubelet is not running as a Windows service, it will not be able to set and monitor
the Preshutdown event,
the node will have to go through the Non-Graceful Node Shutdown procedure mentioned above.
In the case where the Windows graceful node shutdown feature is enabled, but the kubelet is not
running as a Windows service, the kubelet will continue running instead of failing. However,
it will log an error indicating that it needs to be run as a Windows service.
Configuring graceful node shutdown
Note that by default, both configuration options described below,
shutdownGracePeriod and shutdownGracePeriodCriticalPods, are set to zero,
thus not activating the graceful node shutdown functionality.
To activate the feature, both options should be configured appropriately and
set to non-zero values.
Once the kubelet is notified of a node shutdown, it sets a NotReady condition on
the Node, with the reason set to "node is shutting down". The kube-scheduler honors this condition
and does not schedule any Pods onto the affected node; other third-party schedulers are
expected to follow the same logic. This means that new Pods won't be scheduled onto that node
and therefore none will start.
The kubelet also rejects Pods during the PodAdmission phase if an ongoing
node shutdown has been detected, so that even Pods with a
toleration for
node.kubernetes.io/not-ready:NoSchedule do not start there.
When kubelet is setting that condition on its Node via the API,
the kubelet also begins terminating any Pods that are running locally.
During a graceful shutdown, kubelet terminates pods in two phases:
The graceful node shutdown feature is configured with two
KubeletConfiguration options:
shutdownGracePeriod:
Specifies the total duration that the node should delay the shutdown by. This is the total
grace period for pod termination for both regular and
critical pods.
shutdownGracePeriodCriticalPods:
Specifies the duration used to terminate
critical pods
during a node shutdown. This value should be less than shutdownGracePeriod.
Note:
There are cases when Node termination was cancelled by the system (or perhaps manually
by an administrator). In either of those situations the Node will return to the Ready state.
However, Pods which already started the process of termination will not be restored by kubelet
and will need to be re-scheduled.
For example, if shutdownGracePeriod=30s, and
shutdownGracePeriodCriticalPods=10s, kubelet will delay the node shutdown by
30 seconds. During the shutdown, the first 20 (30-10) seconds would be reserved
for gracefully terminating normal pods, and the last 10 seconds would be
reserved for terminating critical pods.
Note:
When pods were evicted during the graceful node shutdown, they are marked as shutdown.
Running kubectl get pods shows the status of the evicted pods as Terminated.
And kubectl describe pod indicates that the pod was evicted because of node shutdown:
Reason:         Terminated
Message:        Pod was terminated in response to imminent node shutdown.
Pod Priority based graceful node shutdown
FEATURE STATE:Kubernetes v1.24 [beta](enabled by default)
To provide more flexibility during graceful node shutdown around the ordering
of pods during shutdown, graceful node shutdown honors the PriorityClass for
Pods, provided that you enabled this feature in your cluster. The feature
allows cluster administrators to explicitly define the ordering of pods
during graceful node shutdown based on
priority classes.
The Graceful Node Shutdown feature, as described
above, shuts down pods in two phases, non-critical pods, followed by critical
pods. If additional flexibility is needed to explicitly define the ordering of
pods during shutdown in a more granular way, pod priority based graceful
shutdown can be used.
When graceful node shutdown honors pod priorities, this makes it possible to do
graceful node shutdown in multiple phases, each phase shutting down a
particular priority class of pods. The kubelet can be configured with the exact
phases and shutdown time per phase.
Assuming the following custom pod
priority classes
in a cluster,
Pod priority class name
Pod priority class value
custom-class-a
100000
custom-class-b
10000
custom-class-c
1000
regular/unset
0
Within the kubelet configuration
the settings for shutdownGracePeriodByPodPriority could look like:
Pod priority class value
Shutdown period
100000
10 seconds
10000
180 seconds
1000
120 seconds
0
60 seconds
The corresponding kubelet config YAML configuration would be:
The above table implies that any pod with priority value >= 100000 will get
just 10 seconds to shut down, any pod with value >= 10000 and < 100000 will get 180
seconds to shut down, any pod with value >= 1000 and < 10000 will get 120 seconds to shut down.
Finally, all other pods will get 60 seconds to shut down.
One doesn't have to specify values corresponding to all of the classes. For
example, you could instead use these settings:
Pod priority class value
Shutdown period
100000
300 seconds
1000
120 seconds
0
60 seconds
In the above case, the pods with custom-class-b will go into the same bucket
as custom-class-c for shutdown.
If there are no pods in a particular range, then the kubelet does not wait
for pods in that priority range. Instead, the kubelet immediately skips to the
next priority class value range.
If this feature is enabled and no configuration is provided, then no ordering
action will be taken.
Using this feature requires enabling the GracefulNodeShutdownBasedOnPodPriorityfeature gate,
and setting ShutdownGracePeriodByPodPriority in the
kubelet config
to the desired configuration containing the pod priority class values and
their respective shutdown periods.
Note:
The ability to take Pod priority into account during graceful node shutdown was introduced
as an Alpha feature in Kubernetes v1.23. In Kubernetes 1.36
the feature is Beta and is enabled by default.
Metrics graceful_shutdown_start_time_seconds and graceful_shutdown_end_time_seconds
are emitted under the kubelet subsystem to monitor node shutdowns.
Non-graceful node shutdown handling
FEATURE STATE:Kubernetes v1.28 [stable](enabled by default)
A node shutdown action may not be detected by kubelet's Node Shutdown Manager,
either because the command does not trigger the inhibitor locks mechanism used by
kubelet or because of a user error, i.e., the ShutdownGracePeriod and
ShutdownGracePeriodCriticalPods are not configured properly. Please refer to above
section Graceful Node Shutdown for more details.
When a node is shutdown but not detected by kubelet's Node Shutdown Manager, the pods
that are part of a StatefulSet
will be stuck in terminating status on the shutdown node and cannot move to a new running node.
This is because kubelet on the shutdown node is not available to delete the pods so
the StatefulSet cannot create a new pod with the same name. If there are volumes used by the pods,
the VolumeAttachments will not be deleted from the original shutdown node so the volumes
used by these pods cannot be attached to a new running node. As a result, the
application running on the StatefulSet cannot function properly. If the original
shutdown node comes up, the pods will be deleted by kubelet and new pods will be
created on a different running node. If the original shutdown node does not come up,
these pods will be stuck in terminating status on the shutdown node forever.
To mitigate the above situation, a user can manually add the taint node.kubernetes.io/out-of-service
with either NoExecute or NoSchedule effect to a Node marking it out-of-service.
If a Node is marked out-of-service with this taint, the pods on the node will be forcefully deleted
if there are no matching tolerations on it and volume detach operations for the pods terminating on
the node will happen immediately. This allows the Pods on the out-of-service node to recover quickly
on a different node.
During a non-graceful shutdown, Pods are terminated in the two phases:
Force delete the Pods that do not have matching out-of-service tolerations.
Immediately perform detach volume operation for such pods.
Note:
Before adding the taint node.kubernetes.io/out-of-service, it should be verified
that the node is already in shutdown or power off state (not in the middle of restarting).
The user is required to manually remove the out-of-service taint after the pods are
moved to a new node and the user has checked that the shutdown node has been
recovered since the user was the one who originally added the taint.
Forced storage detach on timeout
In any situation where a pod deletion has not succeeded for 6 minutes, kubernetes will
force detach volumes being unmounted if the node is unhealthy at that instant. Any
workload still running on the node that uses a force-detached volume will cause a
violation of the
CSI specification,
which states that ControllerUnpublishVolume "must be called after all
NodeUnstageVolume and NodeUnpublishVolume on the volume are called and succeed".
In such circumstances, volumes on the node in question might encounter data corruption.
The forced storage detach behaviour is optional; users might opt to use the "Non-graceful
node shutdown" feature instead.
Force storage detach on timeout can be disabled by setting the disable-force-detach-on-timeout
config field in kube-controller-manager. Disabling the force detach on timeout feature means
that a volume that is hosted on a node that is unhealthy for more than 6 minutes will not have
its associated
VolumeAttachment
deleted.
After this setting has been applied, unhealthy pods still attached to volumes must be recovered
via the Non-Graceful Node Shutdown procedure mentioned above.
Kubernetes can be configured to use swap memory on a node,
allowing the kernel to free up physical memory by swapping out pages to backing storage.
This is useful for multiple use-cases.
For example, nodes running workloads that can benefit from using swap,
such as those that have large memory footprints but only access a portion of that memory at any given time.
It also helps prevent Pods from being terminated during memory pressure spikes,
shields nodes from system-level memory spikes that might compromise its stability,
allows for more flexible memory management on the node, and much more.
Linux nodes support swap; you need to configure each node to enable it.
By default, the kubelet will not start on a Linux node that has swap enabled.
Windows nodes require swap space.
By default, the kubelet does not start on a Windows node that has swap disabled.
How does it work?
There are a number of possible ways that one could envision swap use on a node.
If kubelet is already running on a node, it would need to be restarted after swap is provisioned in order to identify it.
When kubelet starts on a node in which swap is provisioned and available
(with the failSwapOn: false configuration), kubelet will:
Be able to start on this swap-enabled node.
Direct the Container Runtime Interface (CRI) implementation, often referred to as the container runtime,
to allocate zero swap memory to Kubernetes workloads by default.
Swap configuration on a node is exposed to a cluster admin via the
memorySwap in the KubeletConfiguration.
As a cluster administrator, you can specify the node's behaviour in the
presence of swap memory by setting memorySwap.swapBehavior.
Swap behaviors
You need to pick a swap behavior to
use. Different nodes in your cluster can use different swap behaviors.
The swap behaviors you can choose for Linux nodes are:
NoSwap (default)
Workloads running as Pods on this node do not and cannot use swap.
LimitedSwap
Kubernetes workloads can utilize swap memory.
Note:
If you choose the NoSwap behavior, and you configure the kubelet to tolerate
swap space (failSwapOn: false), then your workloads don't use any swap.
However, processes outside of Kubernetes-managed containers, such as systemd
services (and even the kubelet itself!) can utilize swap.
The kubelet uses the container runtime API, and directs the container runtime to
apply specific configuration (for example, in the cgroup v2 case, memory.swap.max) in a manner that will
enable the desired swap configuration for a container. For runtimes that use control groups, or cgroups,
the container runtime is then responsible for writing these settings to the container-level cgroup.
Observability for swap use
Node and container level metric statistics
Kubelet now collects node and container level metric statistics,
which can be accessed at the /metrics/resource (which is used mainly by monitoring
tools like Prometheus) and /stats/summary (which is used mainly by Autoscalers) kubelet HTTP endpoints.
This allows clients who can directly request the kubelet to
monitor swap usage and remaining swap memory when using LimitedSwap.
Additionally, a machine_swap_bytes metric has been added to cadvisor to show
the total physical swap capacity of the machine.
See this page for more info.
For example, these /metrics/resource are supported:
node_swap_usage_bytes: Current swap usage of the node in bytes.
container_swap_usage_bytes: Current amount of the container swap usage in bytes.
container_swap_limit_bytes: Current amount of the container swap limit in bytes.
Using kubectl top --show-swap
Querying metrics is valuable, but somewhat cumbersome, as these metrics
are designed to be used by software rather than humans.
In order to consume this data in a more user-friendly way,
the kubectl top command has been extended to support swap metrics, using the --show-swap flag.
In order to receive information about swap usage on nodes, kubectl top nodes --show-swap can be used:
The <unknown> value indicates that the .status.nodeInfo.swap.capacity field is not set for that Node.
This probably means that the node does not have swap provisioned, or less likely,
that the kubelet is not able to determine the swap capacity of the node.
Swap discovery using Node Feature Discovery (NFD)
Node Feature Discovery
is a Kubernetes addon for detecting hardware features and configuration.
It can be utilized to discover which nodes are provisioned with swap.
As an example, to figure out which nodes are provisioned with swap,
use the following command:
kubectl get nodes -o jsonpath='{range .items[?(@.metadata.labels.feature\.node\.kubernetes\.io/memory-swap)]}{.metadata.name}{"\t"}{.metadata.labels.feature\.node\.kubernetes\.io/memory-swap}{"\n"}{end}'
In this example, swap is provisioned on nodes k8s-worker1 and k8s-worker2, but not on k8s-worker3.
Risks and caveats
Caution:
It is deeply encouraged to encrypt the swap space.
See Memory-backed volumes memory-backed volumes for more info.
Having swap available on a system reduces predictability.
While swap can enhance performance by making more RAM available, swapping data
back to memory is a heavy operation, sometimes slower by many orders of magnitude,
which can cause unexpected performance regressions.
Furthermore, swap changes a system's behaviour under memory pressure.
Enabling swap increases the risk of noisy neighbors,
where Pods that frequently use their RAM may cause other Pods to swap.
In addition, since swap allows for greater memory usage for workloads in Kubernetes that cannot be predictably accounted for,
and due to unexpected packing configurations,
the scheduler currently does not account for swap memory usage.
This heightens the risk of noisy neighbors.
The performance of a node with swap memory enabled depends on the underlying physical storage.
When swap memory is in use, performance will be significantly worse in an I/O
operations per second (IOPS) constrained environment, such as a cloud VM with
I/O throttling, when compared to faster storage mediums like solid-state drives
or NVMe.
As swap might cause IO pressure, it is recommended to give a higher IO latency
priority to system critical daemons. See the relevant section in the
recommended practices section below.
Memory-backed volumes
On Linux nodes, memory-backed volumes (such as secret
volume mounts, or emptyDir with medium: Memory)
are implemented with a tmpfs filesystem.
The contents of such volumes should remain in memory at all times, hence should
not be swapped to disk.
To ensure the contents of such volumes remain in memory, the noswap tmpfs option
is being used.
The Linux kernel officially supports the noswap option from version 6.3 (more info
can be found in Linux Kernel Version Requirements).
However, the different distributions often choose to backport this mount option to older
Linux versions as well.
In order to verify whether the node supports the noswap option, the kubelet will do the following:
If the kernel's version is above 6.3 then the noswap option will be assumed to be supported.
Otherwise, kubelet would try to mount a dummy tmpfs with the noswap option at startup.
If kubelet fails with an error indicating of an unknown option, noswap will be assumed
to not be supported, hence will not be used.
A kubelet log entry will be emitted to warn the user about memory-backed volumes might swap to disk.
If kubelet succeeds, the dummy tmpfs will be deleted and the noswap option will be used.
If the noswap option is not supported, kubelet will emit a warning log entry,
then continue its execution.
See the section above with an example for setting unencrypted swap.
However, handling encrypted swap is not within the scope of kubelet;
rather, it is a general OS configuration concern and should be addressed at that level.
It is the administrator's responsibility to provision encrypted swap to mitigate this risk.
Evictions
Configuring memory eviction thresholds for swap-enabled nodes can be tricky.
With swap being disabled, it is reasonable to configure kubelet's eviction thresholds
to be a bit lower than the node's memory capacity.
The rationale is that we want Kubernetes to start evicting Pods before the node runs out of memory
and invokes the Out Of Memory (OOM) killer, since the OOM killer is not Kubernetes-aware,
therefore does not consider things like QoS, pod priority, or other Kubernetes-specific factors.
With swap enabled, the situation is more complex.
In Linux, the vm.min_free_kbytes parameter defines the memory threshold for the kernel
to start aggressively reclaiming memory, which includes swapping out pages.
If the kubelet's eviction thresholds are set in a way that eviction would take place
before the kernel starts reclaiming memory, it could lead to workloads never
being able to swap out during node memory pressure.
However, setting the eviction thresholds too high could result in the node running out of memory
and invoking the OOM killer, which is not ideal either.
To address this, it is recommended to set the kubelet's eviction thresholds
to be slightly lower than the vm.min_free_kbytes value.
This way, the node can start swapping before kubelet would start evicting Pods,
allowing workloads to swap out unused data and preventing evictions from happening.
On the other hand, since it is just slightly lower, kubelet is likely to start evicting Pods
before the node runs out of memory, thus avoiding the OOM killer.
The value of vm.min_free_kbytes can be determined by running the following command on the node:
cat /proc/sys/vm/min_free_kbytes
Unutilized swap space
Under the LimitedSwap behavior, the amount of swap available to a Pod is determined automatically,
based on the proportion of the memory requested relative to the node's total memory
(For more details, see the section below).
This design means that usually there would be some portion of swap that will remain
restricted for Kubernetes workloads.
For example, since Kubernetes 1.36 does not permit swap use for
Pods in the Guaranteed QoS class,
the amount of swap that's proportional to the memory request for Guaranteed pods would
remain unused by Kubernetes workloads.
This behavior carries some risk in a situation where many pods are not eligible for swapping.
On the other hand, it effectively keeps some system-reserved amount of swap memory that can be used by processes
outside of Kubernetes' scope, such as system daemons and even kubelet itself.
Good practice for using swap in a Kubernetes cluster
Disable swap for system-critical daemons
During the testing phase and based on user feedback, it was observed that the performance
of system-critical daemons and services might degrade.
This implies that system daemons, including the kubelet, could operate slower than usual.
If this issue is encountered, it is advisable to configure the cgroup of the system slice
to prevent swapping (i.e., set memory.swap.max=0).
Protect system-critical daemons for I/O latency
Swap can increase the I/O load on a node.
When memory pressure causes the kernel to rapidly swap pages in and out,
system-critical daemons and services that rely on I/O operations may
experience performance degradation.
To mitigate this, it is recommended for systemd users to prioritize the system slice in terms of I/O latency.
For non-systemd users,
setting up a dedicated cgroup for system daemons and processes and prioritizing I/O latency in the same way is advised.
This can be achieved by setting io.latency for the system slice,
thereby granting it higher I/O priority.
See cgroup's documentation for more info.
Swap and control plane nodes
The Kubernetes project recommends running control plane nodes without any swap space configured.
The control plane primarily hosts Guaranteed QoS Pods, so swap can generally be disabled.
The main concern is that swapping critical services on the control plane could negatively impact performance.
Use of a dedicated disk for swap
The Kubernetes project recommends using encrypted swap, whenever you run nodes with swap enabled.
If swap resides on a partition or the root filesystem, workloads may interfere
with system processes that need to write to disk.
When they share the same disk, processes can overwhelm swap,
disrupting the I/O of kubelet, container runtime, and systemd, which would impact other workloads.
Since swap space is located on a disk, it is crucial to ensure the disk is fast enough for the intended use cases.
Alternatively, one can configure I/O priorities between different mapped areas of a single backing device.
Swap-aware scheduling
Kubernetes 1.36 does not support allocating Pods to nodes in a way that accounts
for swap memory usage. The scheduler typically uses requests for infrastructure resources
to guide Pod placement, and Pods do not request swap space; they just request memory.
This means that the scheduler does not consider swap memory when making scheduling decisions.
While this is something we are actively working on, it is not yet implemented.
In order for administrators to ensure that Pods are not scheduled on nodes
with swap memory unless they are specifically intended to use it,
Administrators can taint nodes with swap available to protect against this problem.
Taints will ensure that workloads which tolerate swap will not spill onto nodes without swap under load.
Selecting storage for optimal performance
The storage device designated for swap space is critical to maintaining system responsiveness
during high memory usage.
Rotational hard disk drives (HDDs) are ill-suited for this task as their mechanical nature introduces significant latency,
leading to severe performance degradation and system thrashing.
For modern performance needs, a device such as a Solid State Drive (SSD) is probably the appropriate choice for swap,
as its low-latency electronic access minimizes the slowdown.
Swap behavior details
How is the swap limit being determined with LimitedSwap?
The configuration of swap memory, including its limitations, presents a significant
challenge. Not only is it prone to misconfiguration, but as a system-level property, any
misconfiguration could potentially compromise the entire node rather than just a specific
workload. To mitigate this risk and ensure the health of the node, we have implemented
Swap with automatic configuration of limitations.
With LimitedSwap, Pods that do not fall under the Burstable QoS classification (i.e.
BestEffort/Guaranteed QoS Pods) are prohibited from utilizing swap memory.
BestEffort QoS Pods exhibit unpredictable memory consumption patterns and lack
information regarding their memory usage, making it difficult to determine a safe
allocation of swap memory.
Conversely, Guaranteed QoS Pods are typically employed for applications that rely on the
precise allocation of resources specified by the workload, with memory being immediately available.
To maintain the aforementioned security and node health guarantees,
these Pods are not permitted to use swap memory when LimitedSwap is in effect.
In addition, high-priority pods are not permitted to use swap in order to ensure the memory
they consume always resides in RAM, hence ready to use.
Prior to detailing the calculation of the swap limit, it is necessary to define the following terms:
nodeTotalMemory: The total amount of physical memory available on the node.
totalPodsSwapAvailable: The total amount of swap memory on the node that is available for use by Pods (some swap memory may be reserved for system use).
containerMemoryRequest: The container's memory request.
In other words, the amount of swap that a container is able to use is proportionate to its
memory request, the node's total physical memory and the total amount of swap memory on
the node that is available for use by Pods.
It is important to note that, for containers within Burstable QoS Pods, it is possible to
opt-out of swap usage by specifying memory requests that are equal to memory limits.
Containers configured in this manner will not have access to swap memory.
For background information, please see the original KEP, KEP-2400,
and its design.
3 - Node Autoscaling
Automatically provision and consolidate the Nodes in your cluster to adapt to demand and optimize cost.
In order to run workloads in your cluster, you need
Nodes. Nodes in your cluster can be autoscaled -
dynamically provisioned, or consolidated to provide needed
capacity while optimizing cost. Autoscaling is performed by Node autoscalers.
Node provisioning
If there are Pods in a cluster that can't be scheduled on existing Nodes, new Nodes can be
automatically added to the cluster—provisioned—to accommodate the Pods. This is
especially useful if the number of Pods changes over time, for example as a result of
combining horizontal workload with Node autoscaling.
Autoscalers provision the Nodes by creating and deleting cloud provider resources backing them. Most
commonly, the resources backing the Nodes are Virtual Machines.
The main goal of provisioning is to make all Pods schedulable. This goal is not always attainable
because of various limitations, including reaching configured provisioning limits, provisioning
configuration not being compatible with a particular set of pods, or the lack of cloud provider
capacity. While provisioning, Node autoscalers often try to achieve additional goals (for example
minimizing the cost of the provisioned Nodes or balancing the number of Nodes between failure
domains).
Autoscaler configuration may also include other Node provisioning triggers (for example the number
of Nodes falling below a configured minimum limit).
Note:
Provisioning was formerly known as scale-up in Cluster Autoscaler.
Pod scheduling constraints
Pods can express scheduling constraints to
impose limitations on the kind of Nodes they can be scheduled on. Node autoscalers take these
constraints into account to ensure that the pending Pods can be scheduled on the provisioned Nodes.
The most common kind of scheduling constraints are the resource requests specified by Pod
containers. Autoscalers will make sure that the provisioned Nodes have enough resources to satisfy
the requests. However, they don't directly take into account the real resource usage of the Pods
after they start running. In order to autoscale Nodes based on actual workload resource usage, you
can combine horizontal workload autoscaling with Node
autoscaling.
Node constraints imposed by autoscaler configuration
The specifics of the provisioned Nodes (for example the amount of resources, the presence of a given
label) depend on autoscaler configuration. Autoscalers can either choose them from a pre-defined set
of Node configurations, or use auto-provisioning.
Auto-provisioning
Node auto-provisioning is a mode of provisioning in which a user doesn't have to fully configure the
specifics of the Nodes that can be provisioned. Instead, the autoscaler dynamically chooses the Node
configuration based on the pending Pods it's reacting to, as well as pre-configured constraints (for
example, the minimum amount of resources or the need for a given label).
Node consolidation
The main consideration when running a cluster is ensuring that all schedulable pods are running,
whilst keeping the cost of the cluster as low as possible. To achieve this, the Pods' resource
requests should utilize as much of the Nodes' resources as possible. From this perspective, the
overall Node utilization in a cluster can be used as a proxy for how cost-effective the cluster is.
Note:
Correctly setting the resource requests of your Pods is as important to the overall
cost-effectiveness of a cluster as optimizing Node utilization.
Combining Node autoscaling with vertical workload autoscaling can
help you achieve this.
Nodes in your cluster can be automatically consolidated in order to improve the overall Node
utilization, and in turn the cost-effectiveness of the cluster. Consolidation happens through
removing a set of underutilized Nodes from the cluster. Optionally, a different set of Nodes can
be provisioned to replace them.
Consolidation, like provisioning, only considers Pod resource requests and not real resource usage
when making decisions.
For the purpose of consolidation, a Node is considered empty if it only has DaemonSet and static
Pods running on it. Removing empty Nodes during consolidation is more straightforward than non-empty
ones, and autoscalers often have optimizations designed specifically for consolidating empty Nodes.
Removing non-empty Nodes during consolidation is disruptive—the Pods running on them are
terminated, and possibly have to be recreated (for example by a Deployment). However, all such
recreated Pods should be able to schedule on existing Nodes in the cluster, or the replacement Nodes
provisioned as part of consolidation. No Pods should normally become pending as a result of
consolidation.
Note:
Autoscalers predict how a recreated Pod will likely be scheduled after a Node is provisioned or
consolidated, but they don't control the actual scheduling. Because of this, some Pods might
become pending as a result of consolidation - if for example a completely new Pod appears while
consolidation is being performed.
Autoscaler configuration may also enable triggering consolidation by other conditions (for example,
the time elapsed since a Node was created), in order to optimize different properties (for example,
the maximum lifespan of Nodes in a cluster).
The details of how consolidation is performed depend on the configuration of a given autoscaler.
Note:
Consolidation was formerly known as scale-down in Cluster Autoscaler.
Autoscalers
The functionalities described in previous sections are provided by Node autoscalers. In addition
to the Kubernetes API, autoscalers also need to interact with cloud provider APIs to provision and
consolidate Nodes. This means that they need to be explicitly integrated with each supported cloud
provider. The performance and feature set of a given autoscaler can differ between cloud provider
integrations.
graph TD
    na[Node autoscaler]
    k8s[Kubernetes]
    cp[Cloud Provider]

    k8s --> |get Pods/Nodes|na
    na --> |drain Nodes|k8s
    na --> |create/remove resources backing Nodes|cp
    cp --> |get resources backing Nodes|na

    classDef white_on_blue fill:#326ce5,stroke:#fff,stroke-width:4px,color:#fff;
    classDef blue_on_white fill:#fff,stroke:#bbb,stroke-width:2px,color:#326ce5;
    class na blue_on_white;
    class k8s,cp white_on_blue;
From the perspective of a cluster user, both autoscalers should provide a similar Node autoscaling
experience. Both will provision new Nodes for unschedulable Pods, and both will consolidate the
Nodes that are no longer optimally utilized.
Different autoscalers may also provide features outside the Node autoscaling scope described on this
page, and those additional features may differ between them.
Consult the sections below, and the linked documentation for the individual autoscalers to decide
which autoscaler fits your use case better.
Cluster Autoscaler
Cluster Autoscaler adds or removes Nodes to pre-configured Node groups. Node groups generally map
to some sort of cloud provider resource group (most commonly a Virtual Machine group). A single
instance of Cluster Autoscaler can simultaneously manage multiple Node groups. When provisioning,
Cluster Autoscaler will add Nodes to the group that best fits the requests of pending Pods. When
consolidating, Cluster Autoscaler always selects specific Nodes to remove, as opposed to just
resizing the underlying cloud provider resource group.
Karpenter auto-provisions Nodes based on NodePool
configurations provided by the cluster operator. Karpenter handles all aspects of node lifecycle,
not just autoscaling. This includes automatically refreshing Nodes once they reach a certain
lifetime, and auto-upgrading Nodes when new worker Node images are released. It works directly with
individual cloud provider resources (most commonly individual Virtual Machines), and doesn't rely on
cloud provider resource groups.
Main differences between Cluster Autoscaler and Karpenter:
Cluster Autoscaler provides features related to just Node autoscaling. Karpenter has a wider
scope, and also provides features intended for managing Node lifecycle altogether (for example,
utilizing disruption to auto-recreate Nodes once they reach a certain lifetime, or auto-upgrade
them to new versions).
Cluster Autoscaler doesn't support auto-provisioning, the Node groups it can provision from have
to be pre-configured. Karpenter supports auto-provisioning, so the user only has to configure a
set of constraints for the provisioned Nodes, instead of fully configuring homogeneous groups.
Cluster Autoscaler provides cloud provider integrations directly, which means that they're a part
of the Kubernetes project. For Karpenter, the Kubernetes project publishes Karpenter as a library
that cloud providers can integrate with to build a Node autoscaler.
Cluster Autoscaler provides integrations with numerous cloud providers, including smaller and less
popular providers. There are fewer cloud providers that integrate with Karpenter, including
AWS, and
Azure.
Combine workload and Node autoscaling
Horizontal workload autoscaling
Node autoscaling usually works in response to Pods—it provisions new Nodes to accommodate
unschedulable Pods, and then consolidates the Nodes once they're no longer needed.
Horizontal workload autoscaling
automatically scales the number of workload replicas to maintain a desired average resource
utilization across the replicas. In other words, it automatically creates new Pods in response to
application load, and then removes the Pods once the load decreases.
You can use Node autoscaling together with horizontal workload autoscaling to autoscale the Nodes in
your cluster based on the average real resource utilization of your Pods.
If the application load increases, the average utilization of its Pods should also increase,
prompting workload autoscaling to create new Pods. Node autoscaling should then provision new Nodes
to accommodate the new Pods.
Once the application load decreases, workload autoscaling should remove unnecessary Pods. Node
autoscaling should, in turn, consolidate the Nodes that are no longer needed.
If configured correctly, this pattern ensures that your application always has the Node capacity to
handle load spikes if needed, but you don't have to pay for the capacity when it's not needed.
Vertical workload autoscaling
When using Node autoscaling, it's important to set Pod resource requests correctly. If the requests
of a given Pod are too low, provisioning a new Node for it might not help the Pod actually run.
If the requests of a given Pod are too high, it might incorrectly prevent consolidating its Node.
Vertical workload autoscaling
automatically adjusts the resource requests of your Pods based on their historical resource usage.
You can use Node autoscaling together with vertical workload autoscaling in order to adjust the
resource requests of your Pods while preserving Node autoscaling capabilities in your cluster.
Caution:
When using Node autoscaling, it's not recommended to set up vertical workload autoscaling for
DaemonSet Pods. Autoscalers have to predict what DaemonSet Pods on a new Node will look like in
order to predict available Node resources. Vertical workload autoscaling might make these
predictions unreliable, leading to incorrect scaling decisions.
Related components
This section describes components providing functionality related to Node autoscaling.
Descheduler
The descheduler is a component providing Node
consolidation functionality based on custom policies, as well as other features related to
optimizing Nodes and Pods (for example deleting frequently restarting Pods).
To learn how to generate certificates for your cluster, see Certificates.
5 - Cluster Networking
Networking is a central part of Kubernetes, but it can be challenging to
understand exactly how it is expected to work. There are 4 distinct networking
problems to address:
Highly-coupled container-to-container communications: this is solved by
Pods and localhost communications.
Pod-to-Pod communications: this is the primary focus of this document.
Pod-to-Service communications: this is covered by Services.
External-to-Service communications: this is also covered by Services.
Kubernetes is all about sharing machines among applications. Typically,
sharing machines requires ensuring that two applications do not try to use the
same ports. Coordinating ports across multiple developers is very difficult to
do at scale and exposes users to cluster-level issues outside of their control.
Dynamic port allocation brings a lot of complications to the system - every
application has to take ports as flags, the API servers have to know how to
insert dynamic port numbers into configuration blocks, services have to know
how to find each other, etc. Rather than deal with this, Kubernetes takes a
different approach.
To learn about the Kubernetes networking model, see here.
Kubernetes IP address ranges
Kubernetes clusters require to allocate non-overlapping IP addresses for Pods, Services and Nodes,
from a range of available addresses configured in the following components:
The network plugin is configured to assign IP addresses to Pods.
The kube-apiserver is configured to assign IP addresses to Services.
The kubelet or the cloud-controller-manager is configured to assign IP addresses to Nodes.
Cluster networking types
Kubernetes clusters, attending to the IP families configured, can be categorized into:
IPv4 only: The network plugin, kube-apiserver and kubelet/cloud-controller-manager are configured to assign only IPv4 addresses.
IPv6 only: The network plugin, kube-apiserver and kubelet/cloud-controller-manager are configured to assign only IPv6 addresses.
The network plugin is configured to assign IPv4 and IPv6 addresses.
The kube-apiserver is configured to assign IPv4 and IPv6 addresses.
The kubelet or cloud-controller-manager is configured to assign IPv4 and IPv6 address.
All components must agree on the configured primary IP family.
Kubernetes clusters only consider the IP families present on the Pods, Services and Nodes objects,
independently of the existing IPs of the represented objects. For example, a server or a pod can have multiple
IP addresses assigned to its interfaces, but only the IP addresses in node.status.addresses or pod.status.ips are
considered when implementing the Kubernetes network model and defining the cluster type.
How to implement the Kubernetes network model
The network model is implemented by the container runtime on each node. The most common container
runtimes use Container Network Interface (CNI)
plugins to manage their network and security capabilities. Many different CNI plugins exist from
many different vendors. Some of these provide only basic features of adding and removing network
interfaces, while others provide more sophisticated solutions, such as integration with other
container orchestration systems, running multiple CNI plugins, advanced IPAM features etc.
See this page
for a non-exhaustive list of networking addons supported by Kubernetes.
What's next
The early design of the networking model and its rationale are described in more detail in the
networking design document.
For future plans and some on-going efforts that aim to improve Kubernetes networking, please
refer to the SIG-Network
KEPs.
6 - Observability
Understand how to gain end-to-end visibility of a Kubernetes cluster through the collection of metrics, logs, and traces.
In Kubernetes, observability is the process of collecting and analyzing metrics, logs, and traces—often referred to as the three pillars of observability—in order to obtain a better understanding of the internal state, performance, and health of the cluster.
Kubernetes control plane components, as well as many add-ons, generate and emit these signals. By aggregating and correlating them, you can gain a unified picture of the control plane, add-ons, and applications across the cluster.
Figure 1 outlines how cluster components emit the three primary signal types.
flowchart LR
    A[Cluster components] --> M[Metrics pipeline]
    A --> L[Log pipeline]
    A --> T[Trace pipeline]
    M --> S[(Storage and analysis)]
    L --> S
    T --> S
    S --> O[Operators and automation]
Figure 1. High-level signals emitted by cluster components and their consumers.
Metrics
Kubernetes components emit metrics in Prometheus format from their /metrics endpoints, including:
kube-controller-manager
kube-proxy
kube-apiserver
kube-scheduler
kubelet
The kubelet also exposes metrics at /metrics/cadvisor, /metrics/resource, and /metrics/probes, and add-ons such as kube-state-metrics enrich those control plane signals with Kubernetes object status.
A typical Kubernetes metrics pipeline periodically scrapes these endpoints and stores the samples in a time series database (for example with Prometheus).
Logs provide a chronological record of events inside applications, Kubernetes system components, and security-related activities such as audit logging.
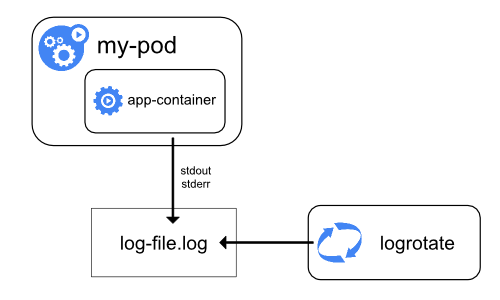
Container runtimes capture a containerized application’s output from standard output (stdout) and standard error (stderr) streams. While runtimes implement this differently, the integration with the kubelet is standardized through the CRI logging format, and the kubelet makes these logs available through kubectl logs.
Figure 3a. Node-level logging architecture.
System component logs capture events from the cluster and are often useful for debugging and troubleshooting. These components are classified in two different ways: those that run in a container and those that do not. For example, the kube-scheduler and kube-proxy usually run in containers, whereas the kubelet and the container runtime run directly on the host.
On machines with systemd, the kubelet and container runtime write to journald. Otherwise, they write to .log files in the /var/log directory.
System components that run inside containers always write to .log files in /var/log, bypassing the default container logging mechanism.
System component and container logs stored under /var/log require log rotation to prevent uncontrolled growth. Some cluster provisioning scripts install log rotation by default; verify your environment and adjust as needed. See the system logs reference for details on locations, formats, and configuration options.
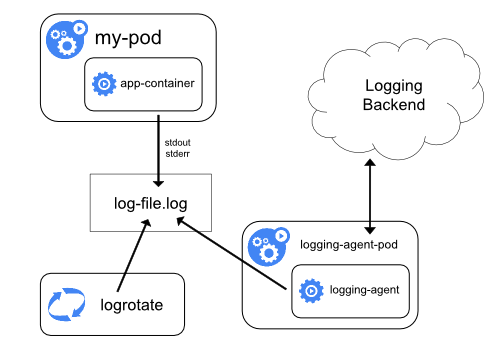
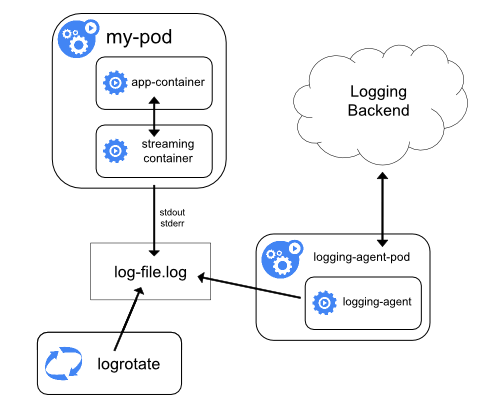
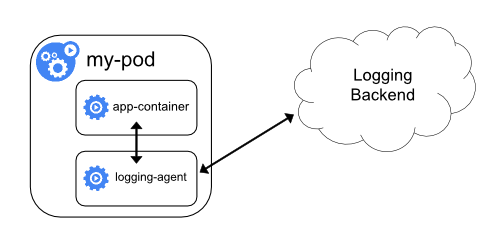
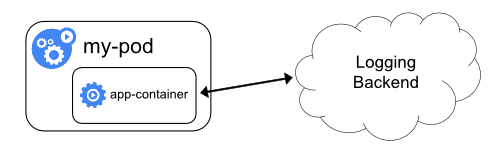
Most clusters run a node-level logging agent (for example, Fluent Bit or Fluentd) that tails these files and forwards entries to a central log store. The logging architecture guidance explains how to design such pipelines, apply retention, and log flows to backends.
Figure 3 outlines a common log aggregation pipeline.
flowchart LR
    subgraph Sources
        A[Application stdout / stderr]
        B[Control plane logs]
        C[Audit records]
    end
    A --> N[Node log agent]
    B --> N
    C --> N
    N --> L[Central log store]
    L --> Q[Dashboards, alerting, SIEM]
Figure 3. Components of a typical Kubernetes logs pipeline.
Traces capture how requests moves across Kubernetes components and applications, linking latency, timing and relationships between operations.By collecting traces, you can visualize end-to-end request flow, diagnose performance issues, and identify bottlenecks or unexpected interactions in the control plane, add-ons, or applications.
Kubernetes 1.36 can export spans over the OpenTelemetry Protocol (OTLP), either directly via built-in gRPC exporters or by forwarding them through an OpenTelemetry Collector.
The OpenTelemetry Collector receives spans from components and applications, processes them (for example by applying sampling or redaction), and forwards them to a tracing backend for storage and analysis.
Figure 4 outlines a typical distributed tracing pipeline.
flowchart LR
    subgraph Sources
        A[Control plane spans]
        B[Application spans]
    end
    A --> X[OTLP exporter]
    B --> X
    X --> COL[OpenTelemetry Collector]
    COL --> TS[(Tracing backend)]
    TS --> V[Visualization and analysis]
Figure 4. Components of a typical Kubernetes traces pipeline.
Note: This section links to third party projects that provide functionality required by Kubernetes. The Kubernetes project authors aren't responsible for these projects, which are listed alphabetically. To add a project to this list, read the content guide before submitting a change. More information.
Note: This section links to third-party projects that provide observability capabilities required by Kubernetes.
The Kubernetes project authors aren't responsible for these projects, which are listed alphabetically. To add a
project to this list, read the content guide before submitting a change.
Recommendations for designing and deploying admission webhooks in Kubernetes.
This page provides good practices and considerations when designing
admission webhooks in Kubernetes. This information is intended for
cluster operators who run admission webhook servers or third-party applications
that modify or validate your API requests.
Before reading this page, ensure that you're familiar with the following
concepts:
Admission control occurs when any create, update, or delete request
is sent to the Kubernetes API. Admission controllers intercept requests that
match specific criteria that you define. These requests are then sent to
mutating admission webhooks or validating admission webhooks. These webhooks are
often written to ensure that specific fields in object specifications exist or
have specific allowed values.
Webhooks are a powerful mechanism to extend the Kubernetes API. Badly-designed
webhooks often result in workload disruptions because of how much control
the webhooks have over objects in the cluster. Like other API extension
mechanisms, webhooks are challenging to test at scale for compatibility with
all of your workloads, other webhooks, add-ons, and plugins.
Additionally, with every release, Kubernetes adds or modifies the API with new
features, feature promotions to beta or stable status, and deprecations. Even
stable Kubernetes APIs are likely to change. For example, the Pod API changed
in v1.29 to add the
Sidecar containers feature.
While it's rare for a Kubernetes object to enter a broken state because of a new
Kubernetes API, webhooks that worked as expected with earlier versions of an API
might not be able to reconcile more recent changes to that API. This can result
in unexpected behavior after you upgrade your clusters to newer versions.
This page describes common webhook failure scenarios and how to avoid them by
cautiously and thoughtfully designing and implementing your webhooks.
Identify whether you use admission webhooks
Even if you don't run your own admission webhooks, some third-party applications
that you run in your clusters might use mutating or validating admission
webhooks.
To check whether your cluster has any mutating admission webhooks, run the
following command:
kubectl get mutatingwebhookconfigurations
The output lists any mutating admission controllers in the cluster.
To check whether your cluster has any validating admission webhooks, run the
following command:
kubectl get validatingwebhookconfigurations
The output lists any validating admission controllers in the cluster.
Choose an admission control mechanism
Kubernetes includes multiple admission control and policy enforcement options.
Knowing when to use a specific option can help you to improve latency and
performance, reduce management overhead, and avoid issues during version
upgrades. The following table describes the mechanisms that let you mutate or
validate resources during admission:
Mutating and validating admission control in Kubernetes
Intercept API requests before admission and validate against CEL
expressions.
Validate critical configurations before resource admission.
Enforce policy logic using CEL expressions.
In general, use webhook admission control when you want an extensible way to
declare or configure the logic. Use built-in CEL-based admission control when
you want to declare simpler logic without the overhead of running a webhook
server. The Kubernetes project recommends that you use CEL-based admission
control when possible.
Use built-in validation and defaulting for CustomResourceDefinitions
If you use
CustomResourceDefinitions,
don't use admission webhooks to validate values in CustomResource specifications
or to set default values for fields. Kubernetes lets you define validation rules
and default field values when you create CustomResourceDefinitions.
This section describes recommendations for improving performance and reducing
latency. In summary, these are as follows:
Consolidate webhooks and limit the number of API calls per webhook.
Use audit logs to check for webhooks that repeatedly do the same action.
Use load balancing for webhook availability.
Set a small timeout value for each webhook.
Consider cluster availability needs during webhook design.
Design admission webhooks for low latency
Mutating admission webhooks are called in sequence. Depending on the mutating
webhook setup, some webhooks might be called multiple times. Every mutating
webhook call adds latency to the admission process. This is unlike validating
webhooks, which get called in parallel.
When designing your mutating webhooks, consider your latency requirements and
tolerance. The more mutating webhooks there are in your cluster, the greater the
chance of latency increases.
Consider the following to reduce latency:
Consolidate webhooks that perform a similar mutation on different objects.
Reduce the number of API calls made in the mutating webhook server logic.
Limit the match conditions of each mutating webhook to reduce how many
webhooks are triggered by a specific API request.
Consolidate small webhooks into one server and configuration to help with
ordering and organization.
Prevent loops caused by competing controllers
Consider any other components that run in your cluster that might conflict with
the mutations that your webhook makes. For example, if your webhook adds a label
that a different controller removes, your webhook gets called again. This leads
to a loop.
To detect these loops, try the following:
Update your cluster audit policy to log audit events. Use the following
parameters:
level: RequestResponse
verbs: ["patch"]
omitStages: RequestReceived
Set the audit rule to create events for the specific resources that your
webhook mutates.
Check your audit events for webhooks being reinvoked multiple times with the
same patch being applied to the same object, or for an object having
a field updated and reverted multiple times.
Set a small timeout value
Admission webhooks should evaluate as quickly as possible (typically in
milliseconds), since they add to API request latency. Use a small timeout for
webhooks.
Use a load balancer to ensure webhook availability
Admission webhooks should leverage some form of load-balancing to provide high
availability and performance benefits. If a webhook is running within the
cluster, you can run multiple webhook backends behind a Service of type
ClusterIP.
Use a high-availability deployment model
Consider your cluster's availability requirements when designing your webhook.
For example, during node downtime or zonal outages, Kubernetes marks Pods as
NotReady to allow load balancers to reroute traffic to available zones and
nodes. These updates to Pods might trigger your mutating webhooks. Depending on
the number of affected Pods, the mutating webhook server has a risk of timing
out or causing delays in Pod processing. As a result, traffic won't get
rerouted as quickly as you need.
Consider situations like the preceding example when writing your webhooks.
Exclude operations that are a result of Kubernetes responding to unavoidable
incidents.
Request filtering
This section provides recommendations for filtering which requests trigger
specific webhooks. In summary, these are as follows:
Limit the webhook scope to avoid system components and read-only requests.
Limit webhooks to specific namespaces.
Use match conditions to perform fine-grained request filtering.
Match all versions of an object.
Limit the scope of each webhook
Admission webhooks are only called when an API request matches the corresponding
webhook configuration. Limit the scope of each webhook to reduce unnecessary
calls to the webhook server. Consider the following scope limitations:
Avoid matching objects in the kube-system namespace. If you run your own
Pods in the kube-system namespace, use an
objectSelector
to avoid mutating a critical workload.
Don't mutate node leases, which exist as Lease objects in the
kube-node-lease system namespace. Mutating node leases might result in
failed node upgrades. Only apply validation controls to Lease objects in this
namespace if you're confident that the controls won't put your cluster at
risk.
Don't mutate TokenReview or SubjectAccessReview objects. These are always
read-only requests. Modifying these objects might break your cluster.
Limit each webhook to a specific namespace by using a
namespaceSelector.
Filter for specific requests by using match conditions
Admission controllers support multiple fields that you can use to match requests
that meet specific criteria. For example, you can use a namespaceSelector to
filter for requests that target a specific namespace.
For more fine-grained request filtering, use the matchConditions field in your
webhook configuration. This field lets you write multiple CEL expressions that
must evaluate to true for a request to trigger your admission webhook. Using
matchConditions might significantly reduce the number of calls to your webhook
server.
By default, admission webhooks run on any API versions that affect a specified
resource. The matchPolicy field in the webhook configuration controls this
behavior. Specify a value of Equivalent in the matchPolicy field or omit
the field to allow the webhook to run on any API version.
This section provides recommendations for the scope of mutations and any special
considerations for object fields. In summary, these are as follows:
Patch only the fields that you need to patch.
Don't overwrite array values.
Avoid side effects in mutations when possible.
Avoid self-mutations.
Fail open and validate the final state.
Plan for future field updates in later versions.
Prevent webhooks from self-triggering.
Don't change immutable objects.
Patch only required fields
Admission webhook servers send HTTP responses to indicate what to do with a
specific Kubernetes API request. This response is an AdmissionReview object.
A mutating webhook can add specific fields to mutate before allowing admission
by using the patchType field and the patch field in the response. Ensure
that you only modify the fields that require a change.
For example, consider a mutating webhook that's configured to ensure that
web-server Deployments have at least three replicas. When a request to
create a Deployment object matches your webhook configuration, the webhook
should only update the value in the spec.replicas field.
Don't overwrite array values
Fields in Kubernetes object specifications might include arrays. Some arrays
contain key:value pairs (like the envVar field in a container specification),
while other arrays are unkeyed (like the readinessGates field in a Pod
specification). The order of values in an array field might matter in some
situations. For example, the order of arguments in the args field of a
container specification might affect the container.
Consider the following when modifying arrays:
Whenever possible, use the add JSONPatch operation instead of replace to
avoid accidentally replacing a required value.
Treat arrays that don't use key:value pairs as sets.
Ensure that the values in the field that you modify aren't required to be
in a specific order.
Use caution when modifying label fields. An accidental modification might
cause label selectors to break, resulting in unintended behavior.
Avoid side effects
Ensure that your webhooks operate only on the content of the AdmissionReview
that's sent to them, and do not make out-of-band changes. These additional
changes, called side effects, might cause conflicts during admission if they
aren't reconciled properly. The .webhooks[].sideEffects field should
be set to None if a webhook doesn't have any side effect.
If side effects are required during the admission evaluation, they must be
suppressed when processing an AdmissionReview object with dryRun set to
true, and the .webhooks[].sideEffects field should be set to NoneOnDryRun.
A webhook running inside the cluster might cause deadlocks for its own
deployment if it is configured to intercept resources required to start its own
Pods.
For example, a mutating admission webhook is configured to admit create Pod
requests only if a certain label is set in the Pod (such as env: prod).
The webhook server runs in a Deployment that doesn't set the env label.
When a node that runs the webhook server Pods becomes unhealthy, the webhook
Deployment tries to reschedule the Pods to another node. However, the existing
webhook server rejects the requests since the env label is unset. As a
result, the migration cannot happen.
Exclude the namespace where your webhook is running with a
namespaceSelector.
Avoid dependency loops
Dependency loops can occur in scenarios like the following:
Two webhooks check each other's Pods. If both webhooks become unavailable
at the same time, neither webhook can start.
Your webhook intercepts cluster add-on components, such as networking plugins
or storage plugins, that your webhook depends on. If both the webhook and the
dependent add-on become unavailable, neither component can function.
To avoid these dependency loops, try the following:
Prevent webhooks from validating or mutating other webhooks. Consider
excluding specific namespaces
from triggering your webhook.
Prevent your webhooks from acting on dependent add-ons by using an
objectSelector.
Fail open and validate the final state
Mutating admission webhooks support the failurePolicy configuration field.
This field indicates whether the API server should admit or reject the request
if the webhook fails. Webhook failures might occur because of timeouts or errors
in the server logic.
By default, admission webhooks set the failurePolicy field to Fail. The API
server rejects a request if the webhook fails. However, rejecting requests by
default might result in compliant requests being rejected during webhook
downtime.
Let your mutating webhooks "fail open" by setting the failurePolicy field to
Ignore. Use a validating controller to check the state of requests to ensure
that they comply with your policies.
This approach has the following benefits:
Mutating webhook downtime doesn't affect compliant resources from deploying.
Policy enforcement occurs during validating admission control.
Mutating webhooks don't interfere with other controllers in the cluster.
Plan for future updates to fields
In general, design your webhooks under the assumption that Kubernetes APIs might
change in a later version. Don't write a server that takes the stability of an
API for granted. For example, the release of sidecar containers in Kubernetes
added a restartPolicy field to the Pod API.
Prevent your webhook from triggering itself
Mutating webhooks that respond to a broad range of API requests might
unintentionally trigger themselves. For example, consider a webhook that
responds to all requests in the cluster. If you configure the webhook to create
Event objects for every mutation, it'll respond to its own Event object
creation requests.
To avoid this, consider setting a unique label in any resources that your
webhook creates. Exclude this label from your webhook match conditions.
Don't change immutable objects
Some Kubernetes objects in the API server can't change. For example, when you
deploy a static Pod, the
kubelet on the node creates a
mirror Pod in the API
server to track the static Pod. However, changes to the mirror Pod don't
propagate to the static Pod.
Don't attempt to mutate these objects during admission. All mirror Pods have the
kubernetes.io/config.mirror annotation. To exclude mirror Pods while reducing
the security risk of ignoring an annotation, allow static Pods to only run in
specific namespaces.
Mutating webhook ordering and idempotence
This section provides recommendations for webhook order and designing idempotent
webhooks. In summary, these are as follows:
Don't rely on a specific order of execution.
Validate mutations before admission.
Check for mutations being overwritten by other controllers.
Ensure that the set of mutating webhooks is idempotent, not just the
individual webhooks.
Don't rely on mutating webhook invocation order
Mutating admission webhooks don't run in a consistent order. Various factors
might change when a specific webhook is called. Don't rely on your webhook
running at a specific point in the admission process. Other webhooks could still
mutate your modified object.
The following recommendations might help to minimize the risk of unintended
changes:
Use a reinvocation policy to observe changes to an object by other plugins
and re-run the webhook as needed. For details, see
Reinvocation policy.
Ensure that the mutating webhooks in your cluster are idempotent
Every mutating admission webhook should be idempotent. The webhook should be
able to run on an object that it already modified without making additional
changes beyond the original change.
Additionally, all of the mutating webhooks in your cluster should, as a
collection, be idempotent. After the mutation phase of admission control ends,
every individual mutating webhook should be able to run on an object without
making additional changes to the object.
Depending on your environment, ensuring idempotence at scale might be
challenging. The following recommendations might help:
Use validating admission controllers to verify the final state of
critical workloads.
Test your deployments in a staging cluster to see if any objects get modified
multiple times by the same webhook.
Ensure that the scope of each mutating webhook is specific and limited.
The following examples show idempotent mutation logic:
For a create Pod request, set the field
.spec.securityContext.runAsNonRoot of the Pod to true.
For a create Pod request, if the field
.spec.containers[].resources.limits of a container is not set, set default
resource limits.
For a create Pod request, inject a sidecar container with name
foo-sidecar if no container with the name foo-sidecar already exists.
In these cases, the webhook can be safely reinvoked, or admit an object that
already has the fields set.
The following examples show non-idempotent mutation logic:
For a create Pod request, inject a sidecar container with name
foo-sidecar suffixed with the current timestamp (such as
foo-sidecar-19700101-000000).
Reinvoking the webhook can result in the same sidecar being injected multiple
times to a Pod, each time with a different container name. Similarly, the
webhook can inject duplicated containers if the sidecar already exists in
a user-provided pod.
For a create/update Pod request, reject if the Pod has label env
set, otherwise add an env: prod label to the Pod.
Reinvoking the webhook will result in the webhook failing on its own output.
For a create Pod request, append a sidecar container named foo-sidecar
without checking whether a foo-sidecar container exists.
Reinvoking the webhook will result in duplicated containers in the Pod, which
makes the request invalid and rejected by the API server.
Mutation testing and validation
This section provides recommendations for testing your mutating webhooks and
validating mutated objects. In summary, these are as follows:
Test webhooks in staging environments.
Avoid mutations that violate validations.
Test minor version upgrades for regressions and conflicts.
Validate mutated objects before admission.
Test webhooks in staging environments
Robust testing should be a core part of your release cycle for new or updated
webhooks. If possible, test any changes to your cluster webhooks in a staging
environment that closely resembles your production clusters. At the very least,
consider using a tool like minikube or
kind to create a small test cluster for webhook
changes.
Ensure that mutations don't violate validations
Your mutating webhooks shouldn't break any of the validations that apply to an
object before admission. For example, consider a mutating webhook that sets the
default CPU request of a Pod to a specific value. If the CPU limit of that Pod
is set to a lower value than the mutated request, the Pod fails admission.
Test every mutating webhook against the validations that run in your cluster.
Test minor version upgrades to ensure consistent behavior
Before upgrading your production clusters to a new minor version, test your
webhooks and workloads in a staging environment. Compare the results to ensure
that your webhooks continue to function as expected after the upgrade.
Additionally, use the following resources to stay informed about API changes:
Mutating webhooks run to completion before any validating webhooks run. There is
no stable order in which mutations are applied to objects. As a result, your
mutations could get overwritten by a mutating webhook that runs at a later time.
Add a validating admission controller like a ValidatingAdmissionWebhook or a
ValidatingAdmissionPolicy to your cluster to ensure that your mutations
are still present. For example, consider a mutating webhook that inserts the
restartPolicy: Always field to specific init containers to make them run as
sidecar containers. You could run a validating webhook to ensure that those
init containers retained the restartPolicy: Always configuration after all
mutations were completed.
This section provides recommendations for deploying your mutating admission
webhooks. In summary, these are as follows:
Gradually roll out the webhook configuration and monitor for issues by
namespace.
Limit access to edit the webhook configuration resources.
Limit access to the namespace that runs the webhook server, if the server is
in-cluster.
Install and enable a mutating webhook
When you're ready to deploy your mutating webhook to a cluster, use the
following order of operations:
Install the webhook server and start it.
Set the failurePolicy field in the MutatingWebhookConfiguration manifest
to Ignore. This lets you avoid disruptions caused by misconfigured webhooks.
Set the namespaceSelector field in the MutatingWebhookConfiguration
manifest to a test namespace.
Deploy the MutatingWebhookConfiguration to your cluster.
Monitor the webhook in the test namespace to check for any issues, then roll the
webhook out to other namespaces. If the webhook intercepts an API request that
it wasn't meant to intercept, pause the rollout and adjust the scope of the
webhook configuration.
Limit edit access to mutating webhooks
Mutating webhooks are powerful Kubernetes controllers. Use RBAC or another
authorization mechanism to limit access to your webhook configurations and
servers. For RBAC, ensure that the following access is only available to trusted
entities:
If your mutating webhook server runs in the cluster, limit access to create or
modify any resources in that namespace.
Examples of good implementations
Note: This section links to third party projects that provide functionality required by Kubernetes. The Kubernetes project authors aren't responsible for these projects, which are listed alphabetically. To add a project to this list, read the content guide before submitting a change. More information.
The following projects are examples of "good" custom webhook server
implementations. You can use them as a starting point when designing your own
webhooks. Don't use these examples as-is; use them as a starting point and
design your webhooks to run well in your specific environment.
8 - Good practices for Dynamic Resource Allocation as a Cluster Admin
This page describes good practices when configuring a Kubernetes cluster
utilizing Dynamic Resource Allocation (DRA). These instructions are for cluster
administrators.
Separate permissions to DRA related APIs
DRA is orchestrated through a number of different APIs. Use authorization tools
(like RBAC, or another solution) to control access to the right APIs depending
on the persona of your user.
In general, DeviceClasses and ResourceSlices should be restricted to admins and
the DRA drivers. Cluster operators that will be deploying Pods with claims will
need access to ResourceClaim and ResourceClaimTemplate APIs; both of these APIs
are namespace scoped.
DRA driver deployment and maintenance
DRA drivers are third-party applications that run on each node of your cluster
to interface with the hardware of that node and Kubernetes' native DRA
components. The installation procedure depends on the driver you choose, but is
likely deployed as a DaemonSet to all or a selection of the nodes (using node
selectors or similar mechanisms) in your cluster.
Use drivers with seamless upgrade if available
DRA drivers implement the kubeletplugin package
interface.
Your driver may support seamless upgrades by implementing a property of this
interface that allows two versions of the same DRA driver to coexist for a short
time. This is only available for kubelet versions 1.33 and above and may not be
supported by your driver for heterogeneous clusters with attached nodes running
older versions of Kubernetes - check your driver's documentation to be sure.
If seamless upgrades are available for your situation, consider using it to
minimize scheduling delays when your driver updates.
If you cannot use seamless upgrades, during driver downtime for upgrades you may
observe that:
Pods cannot start unless the claims they depend on were already prepared for
use.
Cleanup after the last pod which used a claim gets delayed until the driver is
available again. The pod is not marked as terminated. This prevents reusing
the resources used by the pod for other pods.
Running pods will continue to run.
Confirm your DRA driver exposes a liveness probe and utilize it
Your DRA driver likely implements a gRPC socket for healthchecks as part of DRA
driver good practices. The easiest way to utilize this grpc socket is to
configure it as a liveness probe for the DaemonSet deploying your DRA driver.
Your driver's documentation or deployment tooling may already include this, but
if you are building your configuration separately or not running your DRA driver
as a Kubernetes pod, be sure that your orchestration tooling restarts the DRA
driver on failed healthchecks to this grpc socket. Doing so will minimize any
accidental downtime of the DRA driver and give it more opportunities to self
heal, reducing scheduling delays or troubleshooting time.
When draining a node, drain the DRA driver as late as possible
The DRA driver is responsible for unpreparing any devices that were allocated to
Pods, and if the DRA driver is drained before Pods with claims have been deleted, it will not be
able to finalize its cleanup. If you implement custom drain logic for nodes,
consider checking that there are no allocated/reserved ResourceClaim or
ResourceClaimTemplates before terminating the DRA driver itself.
Monitor and tune components for higher load, especially in high scale environments
Control plane component kube-scheduler and the internal ResourceClaim controller
orchestrated by the component kube-controller-manager do the
heavy lifting during scheduling of Pods with claims based on metadata stored in
the DRA APIs. Compared to non-DRA scheduled Pods, the number of API server
calls, memory, and CPU utilization needed by these components is increased for
Pods using DRA claims. In addition, node local components like the DRA driver
and kubelet utilize DRA APIs to allocated the hardware request at Pod sandbox
creation time. Especially in high scale environments where clusters have many
nodes, and/or deploy many workloads that heavily utilize DRA defined resource
claims, the cluster administrator should configure the relevant components to
anticipate the increased load.
The effects of mistuned components can have direct or snowballing affects
causing different symptoms during the Pod lifecycle. If the kube-scheduler
component's QPS and burst configurations are too low, the scheduler might
quickly identify a suitable node for a Pod but take longer to bind the Pod to
that node. With DRA, during Pod scheduling, the QPS and Burst parameters in the
client-go configuration within kube-controller-manager are critical.
The specific values to tune your cluster to depend on a variety of factors like
number of nodes/pods, rate of pod creation, churn, even in non-DRA environments;
see the SIG Scalability README on Kubernetes scalability
thresholds
for more information. In scale tests performed against a DRA enabled cluster
with 100 nodes, involving 720 long-lived pods (90% saturation) and 80 churn pods
(10% churn, 10 times), with a job creation QPS of 10, kube-controller-manager
QPS could be set to as low as 75 and Burst to 150 to meet equivalent metric
targets for non-DRA deployments. At this lower bound, it was observed that the
client side rate limiter was triggered enough to protect the API server from
explosive burst but was high enough that pod startup SLOs were not impacted.
While this is a good starting point, you can get a better idea of how to tune
the different components that have the biggest effect on DRA performance for
your deployment by monitoring the following metrics. For more information on all
the stable metrics in Kubernetes, see the Kubernetes Metrics
Reference.
kube-controller-manager metrics
The following metrics look closely at the internal ResourceClaim controller
managed by the kube-controller-manager component.
Workqueue Add Rate: Monitor sum(rate(workqueue_adds_total{name="resource_claim"}[5m]))to gauge how quickly items are added to the ResourceClaim controller.
Workqueue Depth: Track
sum(workqueue_depth{endpoint="kube-controller-manager",name="resource_claim"}) to identify any backlogs in the ResourceClaim
controller.
Workqueue Work Duration: Observe histogram_quantile(0.99,sum(rate(workqueue_work_duration_seconds_bucket{name="resource_claim"}[5m]))by(le)) to understand the speed at which the ResourceClaim controller
processes work.
If you are experiencing low Workqueue Add Rate, high Workqueue Depth, and/or
high Workqueue Work Duration, this suggests the controller isn't performing
optimally. Consider tuning parameters like QPS, burst, and CPU/memory
configurations.
If you are experiencing high Workequeue Add Rate, high Workqueue Depth, but
reasonable Workqueue Work Duration, this indicates the controller is processing
work, but concurrency might be insufficient. Concurrency is hardcoded in the
controller, so as a cluster administrator, you can tune for this by reducing the
pod creation QPS, so the add rate to the resource claim workqueue is more
manageable.
kube-scheduler metrics
The following scheduler metrics are high level metrics aggregating performance
across all Pods scheduled, not just those using DRA. It is important to note
that the end-to-end metrics are ultimately influenced by the
kube-controller-manager's performance in creating ResourceClaims from
ResourceClainTemplates in deployments that heavily use ResourceClainTemplates.
When a Pod bound to a node must have a ResourceClaim satisfied, kubelet calls
the NodePrepareResources and NodeUnprepareResources methods of the DRA
driver. You can observe this behavior from the kubelet's point of view with the
following metrics.
DRA drivers implement the kubeletplugin package
interface
which surfaces its own metric for the underlying gRPC operation
NodePrepareResources and NodeUnprepareResources. You can observe this
behavior from the point of view of the internal kubeletplugin with the following
metrics.
Application logs can help you understand what is happening inside your application. The
logs are particularly useful for debugging problems and monitoring cluster activity. Most
modern applications have some kind of logging mechanism. Likewise, container engines
are designed to support logging. The easiest and most adopted logging method for
containerized applications is writing to standard output and standard error streams.
However, the native functionality provided by a container engine or runtime is usually
not enough for a complete logging solution.
For example, you may want to access your application's logs if a container crashes,
a pod gets evicted, or a node dies.
In a cluster, logs should have a separate storage and lifecycle independent of nodes,
pods, or containers. This concept is called
cluster-level logging.
Cluster-level logging architectures require a separate backend to store, analyze, and
query logs. Kubernetes does not provide a native storage solution for log data. Instead,
there are many logging solutions that integrate with Kubernetes. The following sections
describe how to handle and store logs on nodes.
Pod and container logs
Kubernetes captures logs from each container in a running Pod.
This example uses a manifest for a Pod with a container
that writes text to the standard output stream, once per second.
To fetch the logs, use the kubectl logs command, as follows:
kubectl logs counter
The output is similar to:
0: Fri Apr  1 11:42:23 UTC 2022
1: Fri Apr  1 11:42:24 UTC 2022
2: Fri Apr  1 11:42:25 UTC 2022
You can use kubectl logs --previous to retrieve logs from a previous instantiation of a container.
If your pod has multiple containers, specify which container's logs you want to access by
appending a container name to the command, with a -c flag, like so:
kubectl logs counter -c count
Container log streams
FEATURE STATE:Kubernetes v1.32 [alpha](disabled by default)
As an alpha feature, the kubelet can split out the logs from the two standard streams produced
by a container: standard output
and standard error.
To use this behavior, you must enable the PodLogsQuerySplitStreamsfeature gate.
With that feature gate enabled, Kubernetes 1.36 allows access to these
log streams directly via the Pod API. You can fetch a specific stream by specifying the stream name (either Stdout or Stderr),
using the stream query string. You must have access to read the log subresource of that Pod.
To demonstrate this feature, you can create a Pod that periodically writes text to both the standard output and error stream.
A container runtime handles and redirects any output generated to a containerized
application's stdout and stderr streams.
Different container runtimes implement this in different ways; however, the integration
with the kubelet is standardized as the CRI logging format.
By default, if a container restarts, the kubelet keeps one terminated container with its logs.
If a pod is evicted from the node, all corresponding containers are also evicted, along with their logs.
The kubelet makes logs available to clients via a special feature of the Kubernetes API.
The usual way to access this is by running kubectl logs.
Log rotation
FEATURE STATE:Kubernetes v1.21 [stable]
The kubelet is responsible for rotating container logs and managing the
logging directory structure.
The kubelet sends this information to the container runtime (using CRI),
and the runtime writes the container logs to the given location.
You can configure two kubelet configuration settings,
containerLogMaxSize (default 10Mi) and containerLogMaxFiles (default 5),
using the kubelet configuration file.
These settings let you configure the maximum size for each log file and the maximum number of
files allowed for each container respectively.
In order to perform an efficient log rotation in clusters where the volume of the logs generated by
the workload is large, kubelet also provides a mechanism to tune how the logs are rotated in
terms of how many concurrent log rotations can be performed and the interval at which the logs are
monitored and rotated as required.
You can configure two kubelet configuration settings,
containerLogMaxWorkers and containerLogMonitorInterval using the
kubelet configuration file.
When you run kubectl logs as in
the basic logging example, the kubelet on the node handles the request and
reads directly from the log file. The kubelet returns the content of the log file.
Note:
Only the contents of the latest log file are available through kubectl logs.
For example, if a Pod writes 40 MiB of logs and the kubelet rotates logs
after 10 MiB, running kubectl logs returns at most 10MiB of data.
System component logs
There are two types of system components: those that typically run in a container,
and those components directly involved in running containers. For example:
The kubelet and container runtime do not run in containers. The kubelet runs
your containers (grouped together in pods)
The Kubernetes scheduler, controller manager, and API server run within pods
(usually static Pods).
The etcd component runs in the control plane, and most commonly also as a static pod.
If your cluster uses kube-proxy, you typically run this as a DaemonSet.
Log locations
The way that the kubelet and container runtime write logs depends on the operating
system that the node uses:
On Linux nodes that use systemd, the kubelet and container runtime write to journald
by default. You use journalctl to read the systemd journal; for example:
journalctl -u kubelet.
If systemd is not present, the kubelet and container runtime write to .log files in the
/var/log directory. If you want to have logs written elsewhere, you can indirectly
run the kubelet via a helper tool, kube-log-runner, and use that tool to redirect
kubelet logs to a directory that you choose.
By default, kubelet directs your container runtime to write logs into directories within
/var/log/pods.
For more information on kube-log-runner, read System Logs.
By default, the kubelet writes logs to files within the directory C:\var\logs
(notice that this is not C:\var\log).
Although C:\var\log is the Kubernetes default location for these logs, several
cluster deployment tools set up Windows nodes to log to C:\var\log\kubelet instead.
If you want to have logs written elsewhere, you can indirectly
run the kubelet via a helper tool, kube-log-runner, and use that tool to redirect
kubelet logs to a directory that you choose.
However, by default, kubelet directs your container runtime to write logs within the
directory C:\var\log\pods.
For more information on kube-log-runner, read System Logs.
For Kubernetes cluster components that run in pods, these write to files inside
the /var/log directory, bypassing the default logging mechanism (the components
do not write to the systemd journal). You can use Kubernetes' storage mechanisms
to map persistent storage into the container that runs the component.
Kubelet allows changing the pod logs directory from default /var/log/pods
to a custom path. This adjustment can be made by configuring the podLogsDir
parameter in the kubelet's configuration file.
Caution:
It's important to note that the default location /var/log/pods has been in use for
an extended period and certain processes might implicitly assume this path.
Therefore, altering this parameter must be approached with caution and at your own risk.
Another caveat to keep in mind is that the kubelet supports the location being on the same
disk as /var. Otherwise, if the logs are on a separate filesystem from /var,
then the kubelet will not track that filesystem's usage, potentially leading to issues if
it fills up.
For details about etcd and its logs, view the etcd documentation.
Again, you can use Kubernetes' storage mechanisms to map persistent storage into
the container that runs the component.
Note:
If you deploy Kubernetes cluster components (such as the scheduler) to log to
a volume shared from the parent node, you need to consider and ensure that those
logs are rotated. Kubernetes does not manage that log rotation.
Your operating system may automatically implement some log rotation - for example,
if you share the directory /var/log into a static Pod for a component, node-level
log rotation treats a file in that directory the same as a file written by any component
outside Kubernetes.
Some deploy tools account for that log rotation and automate it; others leave this
as your responsibility.
Cluster-level logging architectures
While Kubernetes does not provide a native solution for cluster-level logging, there are
several common approaches you can consider. Here are some options:
Use a node-level logging agent that runs on every node.
Include a dedicated sidecar container for logging in an application pod.
Push logs directly to a backend from within an application.
Using a node logging agent
You can implement cluster-level logging by including a node-level logging agent on each node.
The logging agent is a dedicated tool that exposes logs or pushes logs to a backend.
Commonly, the logging agent is a container that has access to a directory with log files from all of the
application containers on that node.
Because the logging agent must run on every node, it is recommended to run the agent
as a DaemonSet.
Node-level logging creates only one agent per node and doesn't require any changes to the
applications running on the node.
Containers write to stdout and stderr, but with no agreed format. A node-level agent collects
these logs and forwards them for aggregation.
Using a sidecar container with the logging agent
You can use a sidecar container in one of the following ways:
The sidecar container streams application logs to its own stdout.
The sidecar container runs a logging agent, which is configured to pick up logs
from an application container.
Streaming sidecar container
By having your sidecar containers write to their own stdout and stderr
streams, you can take advantage of the kubelet and the logging agent that
already run on each node. The sidecar containers read logs from a file, a socket,
or journald. Each sidecar container prints a log to its own stdout or stderr stream.
This approach allows you to separate several log streams from different
parts of your application, some of which can lack support
for writing to stdout or stderr. The logic behind redirecting logs
is minimal, so it's not a significant overhead. Additionally, because
stdout and stderr are handled by the kubelet, you can use built-in tools
like kubectl logs.
For example, a pod runs a single container, and the container
writes to two different log files using two different formats. Here's a
manifest for the Pod:
apiVersion:v1kind:Podmetadata:name:counterspec:containers:- name:countimage:busybox:1.28args:- /bin/sh- -c- > i=0;
while true;
do
echo "$i: $(date)" >> /var/log/1.log;
echo "$(date) INFO $i" >> /var/log/2.log;
i=$((i+1));
sleep 1;
donevolumeMounts:- name:varlogmountPath:/var/logvolumes:- name:varlogemptyDir:{}
It is not recommended to write log entries with different formats to the same log
stream, even if you managed to redirect both components to the stdout stream of
the container. Instead, you can create two sidecar containers. Each sidecar
container could tail a particular log file from a shared volume and then redirect
the logs to its own stdout stream.
Here's a manifest for a pod that has two sidecar containers:
Now when you run this pod, you can access each log stream separately by
running the following commands:
kubectl logs counter count-log-1
The output is similar to:
0: Fri Apr  1 11:42:26 UTC 2022
1: Fri Apr  1 11:42:27 UTC 2022
2: Fri Apr  1 11:42:28 UTC 2022
...
kubectl logs counter count-log-2
The output is similar to:
Fri Apr  1 11:42:29 UTC 2022 INFO 0
Fri Apr  1 11:42:30 UTC 2022 INFO 0
Fri Apr  1 11:42:31 UTC 2022 INFO 0
...
If you installed a node-level agent in your cluster, that agent picks up those log
streams automatically without any further configuration. If you like, you can configure
the agent to parse log lines depending on the source container.
Even for Pods that only have low CPU and memory usage (order of a couple of millicores
for cpu and order of several megabytes for memory), writing logs to a file and
then streaming them to stdout can double how much storage you need on the node.
If you have an application that writes to a single file, it's recommended to set
/dev/stdout as the destination rather than implement the streaming sidecar
container approach.
Sidecar containers can also be used to rotate log files that cannot be rotated by
the application itself. An example of this approach is a small container running
logrotate periodically.
However, it's more straightforward to use stdout and stderr directly, and
leave rotation and retention policies to the kubelet.
Sidecar container with a logging agent
If the node-level logging agent is not flexible enough for your situation, you
can create a sidecar container with a separate logging agent that you have
configured specifically to run with your application.
Note:
Using a logging agent in a sidecar container can lead
to significant resource consumption. Moreover, you won't be able to access
those logs using kubectl logs because they are not controlled
by the kubelet.
Here are two example manifests that you can use to implement a sidecar container with a logging agent.
The first manifest contains a ConfigMap
to configure fluentd.
apiVersion:v1kind:ConfigMapmetadata:name:fluentd-configdata:fluentd.conf:| <source>
type tail
format none
path /var/log/1.log
pos_file /var/log/1.log.pos
tag count.format1
</source>
<source>
type tail
format none
path /var/log/2.log
pos_file /var/log/2.log.pos
tag count.format2
</source>
<match **>
type google_cloud
</match>
Note:
In the sample configurations, you can replace fluentd with any logging agent, reading
from any source inside an application container.
The second manifest describes a pod that has a sidecar container running fluentd.
The pod mounts a volume where fluentd can pick up its configuration data.
10 - Compatibility Version For Kubernetes Control Plane Components
Since release v1.32, we introduced configurable version compatibility and emulation options to Kubernetes control plane components to make upgrades safer by providing more control and increasing the granularity of steps available to cluster administrators.
Emulated Version
The emulation option is set by the --emulated-version flag of control plane components. It allows the component to emulate the behavior (APIs, features, ...) of an earlier version of Kubernetes.
When used, the capabilities available will match the emulated version:
Any capabilities present in the binary version that were introduced after the emulation version will be unavailable.
Any capabilities removed after the emulation version will be available.
This enables a binary from a particular Kubernetes release to emulate the behavior of a previous version with sufficient fidelity that interoperability with other system components can be defined in terms of the emulated version.
The --emulated-version must be <= binaryVersion. See the help message of the --emulated-version flag for supported range of emulated versions.
11 - Metrics For Kubernetes System Components
System component metrics can give a better look into what is happening inside them. Metrics are
particularly useful for building dashboards and alerts.
Kubernetes components emit metrics in Prometheus format.
This format is structured plain text, designed so that people and machines can both read it.
Metrics in Kubernetes
In most cases metrics are available on /metrics endpoint of the HTTP server. For components that
don't expose endpoint by default, it can be enabled using --bind-address flag.
In a production environment you may want to configure Prometheus Server
or some other metrics scraper to periodically gather these metrics and make them available in some
kind of time series database.
Note that kubelet also exposes metrics in
/metrics/cadvisor, /metrics/resource and /metrics/probes endpoints. Those metrics do not
have the same lifecycle.
If your cluster uses RBAC, reading metrics requires
authorization via a user, group or ServiceAccount with a ClusterRole that allows accessing
/metrics. For example:
apiVersion:rbac.authorization.k8s.io/v1kind:ClusterRolemetadata:name:prometheusrules:- nonResourceURLs:- "/metrics"verbs:- get
Alpha metrics have no stability guarantees. These metrics can be modified or deleted at any time.
Beta metrics observe a looser API contract than its stable counterparts. No labels can be removed from beta metrics during their lifetime, however, labels can be added while the metric is in the beta stage.
Stable metrics are guaranteed to not change. This means:
A stable metric without a deprecated signature will not be deleted or renamed
A stable metric's type will not be modified
Deprecated metrics are slated for deletion, but are still available for use.
These metrics include an annotation about the version in which they became deprecated.
For example:
Before deprecation
# HELP some_counter this counts things
# TYPE some_counter counter
some_counter 0
After deprecation
# HELP some_counter (Deprecated since 1.15.0) this counts things
# TYPE some_counter counter
some_counter 0
Hidden metrics are no longer published for scraping, but are still available for use.
A deprecated metric becomes a hidden metric after a period of time, based on its stability level:
STABLE metrics become hidden after a minimum of 3 releases or 9 months, whichever is longer.
BETA metrics become hidden after a minimum of 1 release or 4 months, whichever is longer.
ALPHA metrics can be hidden or removed in the same release in which they are deprecated.
To use a hidden metric, you must enable it. For more details, refer to the Show hidden metrics section.
Deleted metrics are no longer published and cannot be used.
Show hidden metrics
As described above, admins can enable hidden metrics through a command-line flag on a specific
binary. This intends to be used as an escape hatch for admins if they missed the migration of the
metrics deprecated in the last release.
The flag show-hidden-metrics-for-version takes a version for which you want to show metrics
deprecated in that release. The version is expressed as x.y, where x is the major version, y is
the minor version. The patch version is not needed even though a metrics can be deprecated in a
patch release, the reason for that is the metrics deprecation policy runs against the minor release.
The flag can only take the previous minor version as its value. If you want to show all metrics hidden in the previous release, you can set the show-hidden-metrics-for-version flag to the previous version. Using a version that is too old is not allowed because it violates the metrics deprecation policy.
For example, let's assume metric A is deprecated in 1.29. The version in which metric A becomes hidden depends on its stability level:
If metric A is ALPHA, it could be hidden in 1.29.
If metric A is BETA, it will be hidden in 1.30 at the earliest. If you are upgrading to 1.30 and still need A, you must use the command-line flag --show-hidden-metrics-for-version=1.29.
If metric A is STABLE, it will be hidden in 1.32 at the earliest. If you are upgrading to 1.32 and still need A, you must use the command-line flag --show-hidden-metrics-for-version=1.31.
Component metrics
kube-controller-manager metrics
Controller manager metrics provide important insight into the performance and health of the
controller manager. These metrics include common Go language runtime metrics such as go_routine
count and controller specific metrics such as etcd request latencies or Cloudprovider (AWS, GCE,
OpenStack) API latencies that can be used to gauge the health of a cluster.
Starting from Kubernetes 1.7, detailed Cloudprovider metrics are available for storage operations
for GCE, AWS, Vsphere and OpenStack.
These metrics can be used to monitor health of persistent volume operations.
The scheduler exposes optional metrics that reports the requested resources and the desired limits
of all running pods. These metrics can be used to build capacity planning dashboards, assess
current or historical scheduling limits, quickly identify workloads that cannot schedule due to
lack of resources, and compare actual usage to the pod's request.
The kube-scheduler identifies the resource requests and limits
configured for each Pod; when either a request or limit is non-zero, the kube-scheduler reports a
metrics timeseries. The time series is labelled by:
namespace
pod name
the node where the pod is scheduled or an empty string if not yet scheduled
priority
the assigned scheduler for that pod
the name of the resource (for example, cpu)
the unit of the resource if known (for example, cores)
Once a pod reaches completion (has a restartPolicy of Never or OnFailure and is in the
Succeeded or Failed pod phase, or has been deleted and all containers have a terminated state)
the series is no longer reported since the scheduler is now free to schedule other pods to run.
The two metrics are called kube_pod_resource_request and kube_pod_resource_limit.
The metrics are exposed at the HTTP endpoint /metrics/resources. They require
authorization for the /metrics/resources endpoint, usually granted by a
ClusterRole with the get verb for the /metrics/resources non-resource URL.
On Kubernetes 1.21 you must use the --show-hidden-metrics-for-version=1.20
flag to expose these alpha stability metrics.
kubelet Pressure Stall Information (PSI) metrics
FEATURE STATE:Kubernetes v1.36 [stable](enabled by default)
When the kernel has PSI enabled (version 4.20 or later), the kubelet collects
Pressure Stall Information
(PSI) for CPU, memory and I/O usage.
The information is collected at node, pod and container level.
Prometheus Metrics: Exposed at the /metrics/cadvisor endpoint as cumulative counters (totals) representing the total stall time in seconds. The metrics are exposed at this endpoint with the following names:
Summary API: Exposed at the /stats/summary endpoint, providing both the cumulative totals and the moving averages (avg10, avg60, avg300) in a JSON format. These averages represent the percentage of time that tasks were stalled on a resource over the respective 10-second, 60-second, and 5-minute intervals.
These metrics are also natively exported through the node's respective file in /proc/pressure/ -- cpu, memory, and io in the following format:
some avg10=0.00 avg60=0.00 avg300=0.00 total=0
full avg10=0.00 avg60=0.00 avg300=0.00 total=0
How can these metrics be interpreted together? Take for example the following query from the Summary API: kubectl get --raw "/api/v1/nodes/$(kubectl get nodes -o jsonpath='{.items[0].metadata.name}')/proxy/stats/summary" | jq '.pods[].containers[] | select(.name=="<CONTAINER_NAME>") | {name, cpu: .cpu.psi, memory: .memory.psi, io: .io.psi}'.
This returns the information in a json format as such.
Here is a simple spike scenario. The cpu.some avg10 value of 0.74 indicates that in the last 10 seconds, at least one task in this container was stalled on the CPU for 0.74% of the time (0.0074 seconds or 74 milliseconds). Because avg10 (0.74) is significantly higher than avg300 (0.21) on the same resource, this suggests a recent surge in resource contention rather than a sustained long-term bottleneck. If monitored continuously and the avg300 metrics increase as well, we can diagnose a more serious, lasting issue!
Additionally, notice how in this example cpu.some shows pressure, while cpu.full remains at 0.00. This tells us that while some processes were delayed waiting for CPU time, the container as a whole was still making progress. A non-zero full value would indicate that all non-idle tasks were stalled simultaneously, a much bigger problem.
Although not as human-readable, the total value of 35232438 represents the cumulative stall time in microseconds, that allow latency spike detection that otherwise may not show in the averages. They are also useful for monitoring systems, like Prometheus, to calculate precise rates of increase over specific time windows.
As a final note, when observing high I/O Pressure alongside low Memory Pressure, it can indicate that the application is waiting on disk throughput rather than failing due to a lack of available RAM. The node is not over-committed on memory, and a different diagnosis for disk consumption can be investigated.
PSI metrics unlock a more robust way to monitor realitime resource contention at all levels for every cgroup, opening up the opportunity to dynamically handle workloads across the system. You can read more about the PSI metrics in Understand PSI Metrics.
You can explicitly turn off metrics via command line flag --disabled-metrics. This may be
desired if, for example, a metric is causing a performance problem. The input is a list of
disabled metrics (i.e. --disabled-metrics=metric1,metric2).
Metric cardinality enforcement
Metrics with unbounded dimensions could cause memory issues in the components they instrument. To
limit resource use, you can use the --allow-metric-labels command line option to dynamically
configure an allow-list of label values for a metric.
In alpha stage, the flag can only take in a series of mappings as metric label allow-list.
Each mapping is of the format <metric_name>,<label_name>=<allowed_labels> where
<allowed_labels> is a comma-separated list of acceptable label names.
In addition to specifying this from the CLI, this can also be done within a configuration file. You
can specify the path to that configuration file using the --allow-metric-labels-manifest command
line argument to a component. Here's an example of the contents of that configuration file:
Additionally, the cardinality_enforcement_unexpected_categorizations_total meta-metric records the
count of unexpected categorizations during cardinality enforcement, that is, whenever a label value
is encountered that is not allowed with respect to the allow-list constraints.
kube-state-metrics, an add-on agent to generate and expose cluster-level metrics.
The state of Kubernetes objects in the Kubernetes API can be exposed as metrics.
An add-on agent called kube-state-metrics can connect to the Kubernetes API server and expose a HTTP endpoint with metrics generated from the state of individual objects in the cluster.
It exposes various information about the state of objects like labels and annotations, startup and termination times, status or the phase the object currently is in.
For example, containers running in pods create a kube_pod_container_info metric.
This includes the name of the container, the name of the pod it is part of, the namespace the pod is running in, the name of the container image, the ID of the image, the image name from the spec of the container, the ID of the running container and the ID of the pod as labels.
🛇 This item links to a third party project or product that is not part of Kubernetes itself. More information
An external component that is able and capable to scrape the endpoint of kube-state-metrics (for example via Prometheus) can now be used to enable the following use cases.
Example: using metrics from kube-state-metrics to query the cluster state
Metric series generated by kube-state-metrics are helpful to gather further insights into the cluster, as they can be used for querying.
If you use Prometheus or another tool that uses the same query language, the following PromQL query returns the number of pods that are not ready:
count(kube_pod_status_ready{condition="false"}) by (namespace, pod)
Example: alerting based on from kube-state-metrics
Metrics generated from kube-state-metrics also allow for alerting on issues in the cluster.
If you use Prometheus or a similar tool that uses the same alert rule language, the following alert will fire if there are pods that have been in a Terminating state for more than 5 minutes:
groups:- name:Pod staterules:- alert:PodsBlockedInTerminatingStateexpr:count(kube_pod_deletion_timestamp) by (namespace, pod) * count(kube_pod_status_reason{reason="NodeLost"} == 0) by (namespace, pod) > 0for:5mlabels:severity:pageannotations:summary:Pod {{$labels.namespace}}/{{$labels.pod}} blocked in Terminating state.
13 - System Logs
System component logs record events happening in cluster, which can be very useful for debugging.
You can configure log verbosity to see more or less detail.
Logs can be as coarse-grained as showing errors within a component, or as fine-grained as showing
step-by-step traces of events (like HTTP access logs, pod state changes, controller actions, or
scheduler decisions).
Warning:
In contrast to the command line flags described here, the log
output itself does not fall under the Kubernetes API stability guarantees:
individual log entries and their formatting may change from one release
to the next!
Klog
klog is the Kubernetes logging library. klog
generates log messages for the Kubernetes system components.
Kubernetes is in the process of simplifying logging in its components.
The following klog command line flags
are deprecated
starting with Kubernetes v1.23 and removed in Kubernetes v1.26:
--add-dir-header
--alsologtostderr
--log-backtrace-at
--log-dir
--log-file
--log-file-max-size
--logtostderr
--one-output
--skip-headers
--skip-log-headers
--stderrthreshold
Output will always be written to stderr, regardless of the output format. Output redirection is
expected to be handled by the component which invokes a Kubernetes component. This can be a POSIX
shell or a tool like systemd.
In some cases, for example a distroless container or a Windows system service, those options are
not available. Then the
kube-log-runner
binary can be used as wrapper around a Kubernetes component to redirect
output. A prebuilt binary is included in several Kubernetes base images under
its traditional name as /go-runner and as kube-log-runner in server and
node release archives.
This table shows how kube-log-runner invocations correspond to shell redirection:
I1025 00:15:15.525108       1 example.go:79] This is a message
which has a line break.
Structured Logging
FEATURE STATE:Kubernetes v1.23 [beta]
Warning:
Migration to structured log messages is an ongoing process. Not all log messages are structured in
this version. When parsing log files, you must also handle unstructured log messages.
Log formatting and value serialization are subject to change.
Structured logging introduces a uniform structure in log messages allowing for programmatic
extraction of information. You can store and process structured logs with less effort and cost.
The code which generates a log message determines whether it uses the traditional unstructured
klog output or structured logging.
The default formatting of structured log messages is as text, with a format that is backward
compatible with traditional klog:
I1025 00:15:15.525108 1 controller_utils.go:116] "Pod status updated" pod="kube-system/kubedns" status="ready"
Strings are quoted. Other values are formatted with
%+v, which may cause log messages to
continue on the next line depending on the data.
I1025 00:15:15.525108       1 example.go:116] "Example" data="This is text with a line break\nand \"quotation marks\"." someInt=1 someFloat=0.1 someStruct={StringField: First line,
second line.}
Contextual Logging
FEATURE STATE:Kubernetes v1.30 [beta]
Contextual logging builds on top of structured logging. It is primarily about
how developers use logging calls: code based on that concept is more flexible
and supports additional use cases as described in the Contextual Logging
KEP.
If developers use additional functions like WithValues or WithName in
their components, then log entries contain additional information that gets
passed into functions by their caller.
For Kubernetes 1.36, this is gated behind the ContextualLoggingfeature gate and is
enabled by default. The infrastructure for this was added in 1.24 without
modifying components. The
component-base/logs/example
command demonstrates how to use the new logging calls and how a component
behaves that supports contextual logging.
$cd$GOPATH/src/k8s.io/kubernetes/staging/src/k8s.io/component-base/logs/example/cmd/
$ go run . --help
...
--feature-gates mapStringBool A set of key=value pairs that describe feature gates for alpha/experimental features. Options are:
AllAlpha=true|false (ALPHA - default=false)
AllBeta=true|false (BETA - default=false)
ContextualLogging=true|false (BETA - default=true)
$ go run . --feature-gates ContextualLogging=true...
I0222 15:13:31.645988 197901 example.go:54] "runtime" logger="example.myname" foo="bar" duration="1m0s"
I0222 15:13:31.646007 197901 example.go:55] "another runtime" logger="example" foo="bar" duration="1h0m0s" duration="1m0s"
The logger key and foo="bar" were added by the caller of the function
which logs the runtime message and duration="1m0s" value, without having to
modify that function.
With contextual logging disable, WithValues and WithName do nothing and log
calls go through the global klog logger. Therefore this additional information
is not in the log output anymore:
$ go run . --feature-gates ContextualLogging=false...
I0222 15:14:40.497333 198174 example.go:54] "runtime" duration="1m0s"
I0222 15:14:40.497346 198174 example.go:55] "another runtime" duration="1h0m0s" duration="1m0s"
JSON log format
FEATURE STATE:Kubernetes v1.19 [alpha]
Warning:
JSON output does not support many standard klog flags. For list of unsupported klog flags, see the
Command line tool reference.
Not all logs are guaranteed to be written in JSON format (for example, during process start).
If you intend to parse logs, make sure you can handle log lines that are not JSON as well.
Field names and JSON serialization are subject to change.
The --logging-format=json flag changes the format of logs from klog native format to JSON format.
Example of JSON log format (pretty printed):
{"ts":1580306777.04728,"v":4,"msg":"Pod status updated","pod":{"name":"nginx-1","namespace":"default"},"status":"ready"}
Keys with special meaning:
ts - timestamp as Unix time (required, float)
v - verbosity (only for info and not for error messages, int)
err - error string (optional, string)
msg - message (required, string)
List of components currently supporting JSON format:
The -v flag controls log verbosity. Increasing the value increases the number of logged events.
Decreasing the value decreases the number of logged events. Increasing verbosity settings logs
increasingly less severe events. A verbosity setting of 0 logs only critical events.
Log location
There are two types of system components: those that run in a container and those
that do not run in a container. For example:
The Kubernetes scheduler and kube-proxy run in a container.
On machines with systemd, the kubelet and container runtime write to journald.
Otherwise, they write to .log files in the /var/log directory.
System components inside containers always write to .log files in the /var/log directory,
bypassing the default logging mechanism.
Similar to the container logs, you should rotate system component logs in the /var/log directory.
In Kubernetes clusters created by the kube-up.sh script, log rotation is configured by the logrotate tool.
The logrotate tool rotates logs daily, or once the log size is greater than 100MB.
Log query
FEATURE STATE:Kubernetes v1.36 [stable](enabled by default)
The Log Query feature can help debugging issues in both Linux and Windows
nodes. Introduced in Kubernetes v1.27, the feature allows viewing logs of
services running on the node. To use the feature, ensure that the kubelet
configuration options enableSystemLogHandler and enableSystemLogQuery
are both set to true for the target node.
In Kubernetes v1.36 this feature graduated to stable and the NodeLogQueryfeature gate
is now locked to true, hence the feature gate is enabled by default, leaving
enableSystemLogHandler as the only option required to enable or disable the
Log Query feature.
enableSystemLogHandler defaults to false and is recommended to be left
disabled unless actively debugging.
Warning:
Granting permissions to nodes/proxy (even just get permission) also
authorizes access to powerful kubelet APIs that can be used to execute commands
in any container running on the node, so be careful about how you manage them.
See Kubelet authentication/authorization
for more information.
On Linux, the assumption is that service logs are available via journald. On
Windows the assumption is that service logs are available in the application log
provider. On both operating systems, logs are also available by reading files
within /var/log/.
Provided you are authorized to interact with node objects, you can try out this feature on all your nodes or
just a subset. Here is an example to retrieve the kubelet service logs from a node:
# Fetch kubelet logs from a node named node-1.examplekubectl get --raw "/api/v1/nodes/node-1.example/proxy/logs/?query=kubelet"
You can also fetch files, provided that the files are in a directory that the kubelet allows for log
fetches. For example, you can fetch a log from /var/log on a Linux node:
kubectl get --raw "/api/v1/nodes/<insert-node-name-here>/proxy/logs/?query=/<insert-log-file-name-here>"
The kubelet uses heuristics to retrieve logs. This helps if you are not aware whether a given system service is
writing logs to the operating system's native logger like journald or to a log file in /var/log/. The heuristics
first checks the native logger and if that is not available attempts to retrieve the first logs from
/var/log/<servicename> or /var/log/<servicename>.log or /var/log/<servicename>/<servicename>.log.
The complete list of options that can be used are:
Option
Description
boot
boot show messages from a specific system boot
pattern
pattern filters log entries by the provided PERL-compatible regular expression
query
query specifies services(s) or files from which to return logs (required)
sinceTime
an RFC3339 timestamp from which to show logs (inclusive)
untilTime
an RFC3339 timestamp until which to show logs (inclusive)
tailLines
specify how many lines from the end of the log to retrieve; the default is to fetch the whole log
Example of a more complex query:
# Fetch kubelet logs from a node named node-1.example that have the word "error"kubectl get --raw "/api/v1/nodes/node-1.example/proxy/logs/?query=kubelet&pattern=error"
Kubernetes components have built-in gRPC exporters for OTLP to export traces, either with an OpenTelemetry Collector,
or without an OpenTelemetry Collector.
For a complete guide to collecting traces and using the collector, see
Getting Started with the OpenTelemetry Collector.
However, there are a few things to note that are specific to Kubernetes components.
By default, Kubernetes components export traces using the grpc exporter for OTLP on the
IANA OpenTelemetry port, 4317.
As an example, if the collector is running as a sidecar to a Kubernetes component,
the following receiver configuration will collect spans and log them to standard output:
receivers:otlp:protocols:grpc:exporters:# Replace this exporter with the exporter for your backendexporters:debug:verbosity:detailedservice:pipelines:traces:receivers:[otlp]exporters:[debug]
To directly emit traces to a backend without utilizing a collector,
specify the endpoint field in the Kubernetes tracing configuration file with the desired trace backend address.
This method negates the need for a collector and simplifies the overall structure.
For trace backend header configuration, including authentication details, environment variables can be used with OTEL_EXPORTER_OTLP_HEADERS,
see OTLP Exporter Configuration.
Additionally, for trace resource attribute configuration such as Kubernetes cluster name, namespace, Pod name, etc.,
environment variables can also be used with OTEL_RESOURCE_ATTRIBUTES, see OTLP Kubernetes Resource.
Component traces
kube-apiserver traces
The kube-apiserver generates spans for incoming HTTP requests, and for outgoing requests
to webhooks, etcd, and re-entrant requests. It propagates the
W3C Trace Context with outgoing requests
but does not make use of the trace context attached to incoming requests,
as the kube-apiserver is often a public endpoint.
Enabling tracing in the kube-apiserver
To enable tracing, provide the kube-apiserver with a tracing configuration file
with --tracing-config-file=<path-to-config>. This is an example config that records
spans for 1 in 10000 requests, and uses the default OpenTelemetry endpoint:
FEATURE STATE:Kubernetes v1.34 [stable](enabled by default)
The kubelet CRI interface and authenticated http servers are instrumented to generate
trace spans. As with the apiserver, the endpoint and sampling rate are configurable.
Trace context propagation is also configured. A parent span's sampling decision is always respected.
A provided tracing configuration sampling rate will apply to spans without a parent.
Enabled without a configured endpoint, the default OpenTelemetry Collector receiver address of "localhost:4317" is set.
Enabling tracing in the kubelet
To enable tracing, apply the tracing configuration.
This is an example snippet of a kubelet config that records spans for 1 in 10000 requests, and uses the default OpenTelemetry endpoint:
If the samplingRatePerMillion is set to one million (1000000), then every
span will be sent to the exporter.
The kubelet in Kubernetes v1.36 collects spans from
the garbage collection, pod synchronization routine as well as every gRPC
method. The kubelet propagates trace context with gRPC requests so that
container runtimes with trace instrumentation, such as CRI-O and containerd,
can associate their exported spans with the trace context from the kubelet.
The resulting traces will have parent-child links between kubelet and
container runtime spans, providing helpful context when debugging node
issues.
Please note that exporting spans always comes with a small performance overhead
on the networking and CPU side, depending on the overall configuration of the
system. If there is any issue like that in a cluster which is running with
tracing enabled, then mitigate the problem by either reducing the
samplingRatePerMillion or disabling tracing completely by removing the
configuration.
Stability
Tracing instrumentation is still under active development, and may change
in a variety of ways. This includes span names, attached attributes,
instrumented endpoints, etc. Until this feature graduates to stable,
there are no guarantees of backwards compatibility for tracing instrumentation.
existence and implementation varies from cluster to cluster (e.g. nginx)
sits between all clients and one or more apiservers
acts as load balancer if there are several apiservers.
Cloud Load Balancers on external services:
are provided by some cloud providers (e.g. AWS ELB, Google Cloud Load Balancer)
are created automatically when the Kubernetes service has type LoadBalancer
usually supports UDP/TCP only
SCTP support is up to the load balancer implementation of the cloud provider
implementation varies by cloud provider.
Kubernetes users will typically not need to worry about anything other than the first two types. The cluster admin
will typically ensure that the latter types are set up correctly.
Requesting redirects
Proxies have replaced redirect capabilities. Redirects have been deprecated.
16 - API Priority and Fairness
FEATURE STATE:Kubernetes v1.29 [stable]
Controlling the behavior of the Kubernetes API server in an overload situation
is a key task for cluster administrators. The kube-apiserver has some controls available
(i.e. the --max-requests-inflight and --max-mutating-requests-inflight
command-line flags) to limit the amount of outstanding work that will be
accepted, preventing a flood of inbound requests from overloading and
potentially crashing the API server, but these flags are not enough to ensure
that the most important requests get through in a period of high traffic.
The API Priority and Fairness feature (APF) is an alternative that improves upon
aforementioned max-inflight limitations. APF classifies
and isolates requests in a more fine-grained way. It also introduces
a limited amount of queuing, so that no requests are rejected in cases
of very brief bursts. Requests are dispatched from queues using a
fair queuing technique so that, for example, a poorly-behaved
controller need not
starve others (even at the same priority level).
This feature is designed to work well with standard controllers, which
use informers and react to failures of API requests with exponential
back-off, and other clients that also work this way.
Caution:
Some requests classified as "long-running"—such as remote
command execution or log tailing—are not subject to the API
Priority and Fairness filter. This is also true for the
--max-requests-inflight flag without the API Priority and Fairness
feature enabled. API Priority and Fairness does apply to watch
requests. When API Priority and Fairness is disabled, watch requests
are not subject to the --max-requests-inflight limit.
Enabling/Disabling API Priority and Fairness
The API Priority and Fairness feature is controlled by a command-line flag
and is enabled by default. See
Options
for a general explanation of the available kube-apiserver command-line
options and how to enable and disable them. The name of the
command-line option for APF is "--enable-priority-and-fairness". This feature
also involves an API Group
with: (a) a stable v1 version, introduced in 1.29, and
enabled by default (b) a v1beta3 version, enabled by default, and
deprecated in v1.29. You can
disable the API group beta version v1beta3 by adding the
following command-line flags to your kube-apiserver invocation:
kube-apiserver \
--runtime-config=flowcontrol.apiserver.k8s.io/v1beta3=false\
# …and other flags as usual
The command-line flag --enable-priority-and-fairness=false will disable the
API Priority and Fairness feature.
Recursive server scenarios
API Priority and Fairness must be used carefully in recursive server
scenarios. These are scenarios in which some server A, while serving
a request, issues a subsidiary request to some server B. Perhaps
server B might even make a further subsidiary call back to server
A. In situations where Priority and Fairness control is applied to
both the original request and some subsidiary ones(s), no matter how
deep in the recursion, there is a danger of priority inversions and/or
deadlocks.
One example of recursion is when the kube-apiserver issues an
admission webhook call to server B, and while serving that call,
server B makes a further subsidiary request back to the
kube-apiserver. Another example of recursion is when an APIService
object directs the kube-apiserver to delegate requests about a
certain API group to a custom external server B (this is one of the
things called "aggregation").
When the original request is known to belong to a certain priority
level, and the subsidiary controlled requests are classified to higher
priority levels, this is one possible solution. When the original
requests can belong to any priority level, the subsidiary controlled
requests have to be exempt from Priority and Fairness limitation. One
way to do that is with the objects that configure classification and
handling, discussed below. Another way is to disable Priority and
Fairness on server B entirely, using the techniques discussed above. A
third way, which is the simplest to use when server B is not
kube-apiserver, is to build server B with Priority and Fairness
disabled in the code.
Concepts
There are several distinct features involved in the API Priority and Fairness
feature. Incoming requests are classified by attributes of the request using
FlowSchemas, and assigned to priority levels. Priority levels add a degree of
isolation by maintaining separate concurrency limits, so that requests assigned
to different priority levels cannot starve each other. Within a priority level,
a fair-queuing algorithm prevents requests from different flows from starving
each other, and allows for requests to be queued to prevent bursty traffic from
causing failed requests when the average load is acceptably low.
Priority Levels
Without APF enabled, overall concurrency in the API server is limited by the
kube-apiserver flags --max-requests-inflight and
--max-mutating-requests-inflight. With APF enabled, the concurrency limits
defined by these flags are summed and then the sum is divided up among a
configurable set of priority levels. Each incoming request is assigned to a
single priority level, and each priority level will only dispatch as many
concurrent requests as its particular limit allows.
The default configuration, for example, includes separate priority levels for
leader-election requests, requests from built-in controllers, and requests from
Pods. This means that an ill-behaved Pod that floods the API server with
requests cannot prevent leader election or actions by the built-in controllers
from succeeding.
The concurrency limits of the priority levels are periodically
adjusted, allowing under-utilized priority levels to temporarily lend
concurrency to heavily-utilized levels. These limits are based on
nominal limits and bounds on how much concurrency a priority level may
lend and how much it may borrow, all derived from the configuration
objects mentioned below.
Seats Occupied by a Request
The above description of concurrency management is the baseline story.
Requests have different durations but are counted equally at any given
moment when comparing against a priority level's concurrency limit. In
the baseline story, each request occupies one unit of concurrency. The
word "seat" is used to mean one unit of concurrency, inspired by the
way each passenger on a train or aircraft takes up one of the fixed
supply of seats.
But some requests take up more than one seat. Some of these are list
requests that the server estimates will return a large number of
objects. These have been found to put an exceptionally heavy burden
on the server. For this reason, the server estimates the number of objects
that will be returned and considers the request to take a number of seats
that is proportional to that estimated number.
Execution time tweaks for watch requests
API Priority and Fairness manages watch requests, but this involves a
couple more excursions from the baseline behavior. The first concerns
how long a watch request is considered to occupy its seat. Depending
on request parameters, the response to a watch request may or may not
begin with create notifications for all the relevant pre-existing
objects. API Priority and Fairness considers a watch request to be
done with its seat once that initial burst of notifications, if any,
is over.
The normal notifications are sent in a concurrent burst to all
relevant watch response streams whenever the server is notified of an
object create/update/delete. To account for this work, API Priority
and Fairness considers every write request to spend some additional
time occupying seats after the actual writing is done. The server
estimates the number of notifications to be sent and adjusts the write
request's number of seats and seat occupancy time to include this
extra work.
Queuing
Even within a priority level there may be a large number of distinct sources of
traffic. In an overload situation, it is valuable to prevent one stream of
requests from starving others (in particular, in the relatively common case of a
single buggy client flooding the kube-apiserver with requests, that buggy client
would ideally not have much measurable impact on other clients at all). This is
handled by use of a fair-queuing algorithm to process requests that are assigned
the same priority level. Each request is assigned to a flow, identified by the
name of the matching FlowSchema plus a flow distinguisher — which
is either the requesting user, the target resource's namespace, or nothing — and the
system attempts to give approximately equal weight to requests in different
flows of the same priority level.
To enable distinct handling of distinct instances, controllers that have
many instances should authenticate with distinct usernames
After classifying a request into a flow, the API Priority and Fairness
feature then may assign the request to a queue. This assignment uses
a technique known as shuffle sharding, which makes relatively efficient use of
queues to insulate low-intensity flows from high-intensity flows.
The details of the queuing algorithm are tunable for each priority level, and
allow administrators to trade off memory use, fairness (the property that
independent flows will all make progress when total traffic exceeds capacity),
tolerance for bursty traffic, and the added latency induced by queuing.
Exempt requests
Some requests are considered sufficiently important that they are not subject to
any of the limitations imposed by this feature. These exemptions prevent an
improperly-configured flow control configuration from totally disabling an API
server.
Resources
The flow control API involves two kinds of resources.
PriorityLevelConfigurations
define the available priority levels, the share of the available concurrency
budget that each can handle, and allow for fine-tuning queuing behavior.
FlowSchemas
are used to classify individual inbound requests, matching each to a
single PriorityLevelConfiguration.
PriorityLevelConfiguration
A PriorityLevelConfiguration represents a single priority level. Each
PriorityLevelConfiguration has an independent limit on the number of outstanding
requests, and limitations on the number of queued requests.
The nominal concurrency limit for a PriorityLevelConfiguration is not
specified in an absolute number of seats, but rather in "nominal
concurrency shares." The total concurrency limit for the API Server is
distributed among the existing PriorityLevelConfigurations in
proportion to these shares, to give each level its nominal limit in
terms of seats. This allows a cluster administrator to scale up or
down the total amount of traffic to a server by restarting
kube-apiserver with a different value for --max-requests-inflight
(or --max-mutating-requests-inflight), and all
PriorityLevelConfigurations will see their maximum allowed concurrency
go up (or down) by the same fraction.
Caution:
In the versions before v1beta3 the relevant
PriorityLevelConfiguration field is named "assured concurrency shares"
rather than "nominal concurrency shares". Also, in Kubernetes release
1.25 and earlier there were no periodic adjustments: the
nominal/assured limits were always applied without adjustment.
The bounds on how much concurrency a priority level may lend and how
much it may borrow are expressed in the PriorityLevelConfiguration as
percentages of the level's nominal limit. These are resolved to
absolute numbers of seats by multiplying with the nominal limit /
100.0 and rounding. The dynamically adjusted concurrency limit of a
priority level is constrained to lie between (a) a lower bound of its
nominal limit minus its lendable seats and (b) an upper bound of its
nominal limit plus the seats it may borrow. At each adjustment the
dynamic limits are derived by each priority level reclaiming any lent
seats for which demand recently appeared and then jointly fairly
responding to the recent seat demand on the priority levels, within
the bounds just described.
Caution:
With the Priority and Fairness feature enabled, the total concurrency limit for
the server is set to the sum of --max-requests-inflight and
--max-mutating-requests-inflight. There is no longer any distinction made
between mutating and non-mutating requests; if you want to treat them
separately for a given resource, make separate FlowSchemas that match the
mutating and non-mutating verbs respectively.
When the volume of inbound requests assigned to a single
PriorityLevelConfiguration is more than its permitted concurrency level, the
type field of its specification determines what will happen to extra requests.
A type of Reject means that excess traffic will immediately be rejected with
an HTTP 429 (Too Many Requests) error. A type of Queue means that requests
above the threshold will be queued, with the shuffle sharding and fair queuing techniques used
to balance progress between request flows.
The queuing configuration allows tuning the fair queuing algorithm for a
priority level. Details of the algorithm can be read in the
enhancement proposal, but in short:
Increasing queues reduces the rate of collisions between different flows, at
the cost of increased memory usage. A value of 1 here effectively disables the
fair-queuing logic, but still allows requests to be queued.
Increasing queueLengthLimit allows larger bursts of traffic to be
sustained without dropping any requests, at the cost of increased
latency and memory usage.
Changing handSize allows you to adjust the probability of collisions between
different flows and the overall concurrency available to a single flow in an
overload situation.
Note:
A larger handSize makes it less likely for two individual flows to collide
(and therefore for one to be able to starve the other), but more likely that
a small number of flows can dominate the apiserver. A larger handSize also
potentially increases the amount of latency that a single high-traffic flow
can cause. The maximum number of queued requests possible from a
single flow is handSize * queueLengthLimit.
Following is a table showing an interesting collection of shuffle
sharding configurations, showing for each the probability that a
given mouse (low-intensity flow) is squished by the elephants (high-intensity flows) for
an illustrative collection of numbers of elephants. See
https://play.golang.org/p/Gi0PLgVHiUg , which computes this table.
Example Shuffle Sharding Configurations
HandSize
Queues
1 elephant
4 elephants
16 elephants
12
32
4.428838398950118e-09
0.11431348830099144
0.9935089607656024
10
32
1.550093439632541e-08
0.0626479840223545
0.9753101519027554
10
64
6.601827268370426e-12
0.00045571320990370776
0.49999929150089345
9
64
3.6310049976037345e-11
0.00045501212304112273
0.4282314876454858
8
64
2.25929199850899e-10
0.0004886697053040446
0.35935114681123076
8
128
6.994461389026097e-13
3.4055790161620863e-06
0.02746173137155063
7
128
1.0579122850901972e-11
6.960839379258192e-06
0.02406157386340147
7
256
7.597695465552631e-14
6.728547142019406e-08
0.0006709661542533682
6
256
2.7134626662687968e-12
2.9516464018476436e-07
0.0008895654642000348
6
512
4.116062922897309e-14
4.982983350480894e-09
2.26025764343413e-05
6
1024
6.337324016514285e-16
8.09060164312957e-11
4.517408062903668e-07
FlowSchema
A FlowSchema matches some inbound requests and assigns them to a
priority level. Every inbound request is tested against FlowSchemas,
starting with those with the numerically lowest matchingPrecedence and
working upward. The first match wins.
Caution:
Only the first matching FlowSchema for a given request matters. If multiple
FlowSchemas match a single inbound request, it will be assigned based on the one
with the highest matchingPrecedence. If multiple FlowSchemas with equal
matchingPrecedence match the same request, the one with lexicographically
smaller name will win, but it's better not to rely on this, and instead to
ensure that no two FlowSchemas have the same matchingPrecedence.
A FlowSchema matches a given request if at least one of its rules
matches. A rule matches if at least one of its subjectsand at least
one of its resourceRules or nonResourceRules (depending on whether the
incoming request is for a resource or non-resource URL) match the request.
For the name field in subjects, and the verbs, apiGroups, resources,
namespaces, and nonResourceURLs fields of resource and non-resource rules,
the wildcard * may be specified to match all values for the given field,
effectively removing it from consideration.
A FlowSchema's distinguisherMethod.type determines how requests matching that
schema will be separated into flows. It may be ByUser, in which one requesting
user will not be able to starve other users of capacity; ByNamespace, in which
requests for resources in one namespace will not be able to starve requests for
resources in other namespaces of capacity; or blank (or distinguisherMethod may be
omitted entirely), in which all requests matched by this FlowSchema will be
considered part of a single flow. The correct choice for a given FlowSchema
depends on the resource and your particular environment.
Defaults
Each kube-apiserver maintains two sorts of APF configuration objects:
mandatory and suggested.
Mandatory Configuration Objects
The four mandatory configuration objects reflect fixed built-in
guardrail behavior. This is behavior that the servers have before
those objects exist, and when those objects exist their specs reflect
this behavior. The four mandatory objects are as follows.
The mandatory exempt priority level is used for requests that are
not subject to flow control at all: they will always be dispatched
immediately. The mandatory exempt FlowSchema classifies all
requests from the system:masters group into this priority
level. You may define other FlowSchemas that direct other requests
to this priority level, if appropriate.
The mandatory catch-all priority level is used in combination with
the mandatory catch-all FlowSchema to make sure that every request
gets some kind of classification. Typically you should not rely on
this catch-all configuration, and should create your own catch-all
FlowSchema and PriorityLevelConfiguration (or use the suggested
global-default priority level that is installed by default) as
appropriate. Because it is not expected to be used normally, the
mandatory catch-all priority level has a very small concurrency
share and does not queue requests.
Suggested Configuration Objects
The suggested FlowSchemas and PriorityLevelConfigurations constitute a
reasonable default configuration. You can modify these and/or create
additional configuration objects if you want. If your cluster is
likely to experience heavy load then you should consider what
configuration will work best.
The suggested configuration groups requests into six priority levels:
The node-high priority level is for health updates from nodes.
The system priority level is for non-health requests from the
system:nodes group, i.e. Kubelets, which must be able to contact
the API server in order for workloads to be able to schedule on
them.
The leader-election priority level is for leader election requests from
built-in controllers (in particular, requests for endpoints, configmaps,
or leases coming from the system:kube-controller-manager or
system:kube-scheduler users and service accounts in the kube-system
namespace). These are important to isolate from other traffic because failures
in leader election cause their controllers to fail and restart, which in turn
causes more expensive traffic as the new controllers sync their informers.
The workload-high priority level is for other requests from built-in
controllers.
The workload-low priority level is for requests from any other service
account, which will typically include all requests from controllers running in
Pods.
The global-default priority level handles all other traffic, e.g.
interactive kubectl commands run by nonprivileged users.
The suggested FlowSchemas serve to steer requests into the above
priority levels, and are not enumerated here.
Maintenance of the Mandatory and Suggested Configuration Objects
Each kube-apiserver independently maintains the mandatory and
suggested configuration objects, using initial and periodic behavior.
Thus, in a situation with a mixture of servers of different versions
there may be thrashing as long as different servers have different
opinions of the proper content of these objects.
Each kube-apiserver makes an initial maintenance pass over the
mandatory and suggested configuration objects, and after that does
periodic maintenance (once per minute) of those objects.
For the mandatory configuration objects, maintenance consists of
ensuring that the object exists and, if it does, has the proper spec.
The server refuses to allow a creation or update with a spec that is
inconsistent with the server's guardrail behavior.
Maintenance of suggested configuration objects is designed to allow
their specs to be overridden. Deletion, on the other hand, is not
respected: maintenance will restore the object. If you do not want a
suggested configuration object then you need to keep it around but set
its spec to have minimal consequences. Maintenance of suggested
objects is also designed to support automatic migration when a new
version of the kube-apiserver is rolled out, albeit potentially with
thrashing while there is a mixed population of servers.
Maintenance of a suggested configuration object consists of creating
it --- with the server's suggested spec --- if the object does not
exist. OTOH, if the object already exists, maintenance behavior
depends on whether the kube-apiservers or the users control the
object. In the former case, the server ensures that the object's spec
is what the server suggests; in the latter case, the spec is left
alone.
The question of who controls the object is answered by first looking
for an annotation with key apf.kubernetes.io/autoupdate-spec. If
there is such an annotation and its value is true then the
kube-apiservers control the object. If there is such an annotation
and its value is false then the users control the object. If
neither of those conditions holds then the metadata.generation of the
object is consulted. If that is 1 then the kube-apiservers control
the object. Otherwise the users control the object. These rules were
introduced in release 1.22 and their consideration of
metadata.generation is for the sake of migration from the simpler
earlier behavior. Users who wish to control a suggested configuration
object should set its apf.kubernetes.io/autoupdate-spec annotation
to false.
Maintenance of a mandatory or suggested configuration object also
includes ensuring that it has an apf.kubernetes.io/autoupdate-spec
annotation that accurately reflects whether the kube-apiservers
control the object.
Maintenance also includes deleting objects that are neither mandatory
nor suggested but are annotated
apf.kubernetes.io/autoupdate-spec=true.
Health check concurrency exemption
The suggested configuration gives no special treatment to the health
check requests on kube-apiservers from their local kubelets --- which
tend to use the secured port but supply no credentials. With the
suggested config, these requests get assigned to the global-default
FlowSchema and the corresponding global-default priority level,
where other traffic can crowd them out.
If you add the following additional FlowSchema, this exempts those
requests from rate limiting.
Caution:
Making this change also allows any hostile party to then send
health-check requests that match this FlowSchema, at any volume they
like. If you have a web traffic filter or similar external security
mechanism to protect your cluster's API server from general internet
traffic, you can configure rules to block any health check requests
that originate from outside your cluster.
In versions of Kubernetes before v1.20, the labels flow_schema and
priority_level were inconsistently named flowSchema and priorityLevel,
respectively. If you're running Kubernetes versions v1.19 and earlier, you
should refer to the documentation for your version.
When you enable the API Priority and Fairness feature, the kube-apiserver
exports additional metrics. Monitoring these can help you determine whether your
configuration is inappropriately throttling important traffic, or find
poorly-behaved workloads that may be harming system health.
Maturity level BETA
apiserver_flowcontrol_rejected_requests_total is a counter vector
(cumulative since server start) of requests that were rejected,
broken down by the labels flow_schema (indicating the one that
matched the request), priority_level (indicating the one to which
the request was assigned), and reason. The reason label will be
one of the following values:
queue-full, indicating that too many requests were already
queued.
concurrency-limit, indicating that the
PriorityLevelConfiguration is configured to reject rather than
queue excess requests.
time-out, indicating that the request was still in the queue
when its queuing time limit expired.
cancelled, indicating that the request is not purge locked
and has been ejected from the queue.
apiserver_flowcontrol_dispatched_requests_total is a counter
vector (cumulative since server start) of requests that began
executing, broken down by flow_schema and priority_level.
apiserver_flowcontrol_current_inqueue_requests is a gauge vector
holding the instantaneous number of queued (not executing) requests,
broken down by priority_level and flow_schema.
apiserver_flowcontrol_current_executing_requests is a gauge vector
holding the instantaneous number of executing (not waiting in a
queue) requests, broken down by priority_level and flow_schema.
apiserver_flowcontrol_current_executing_seats is a gauge vector
holding the instantaneous number of occupied seats, broken down by
priority_level and flow_schema.
apiserver_flowcontrol_request_wait_duration_seconds is a histogram
vector of how long requests spent queued, broken down by the labels
flow_schema, priority_level, and execute. The execute label
indicates whether the request has started executing.
Note:
Since each FlowSchema always assigns requests to a single
PriorityLevelConfiguration, you can add the histograms for all the
FlowSchemas for one priority level to get the effective histogram for
requests assigned to that priority level.
apiserver_flowcontrol_nominal_limit_seats is a gauge vector
holding each priority level's nominal concurrency limit, computed
from the API server's total concurrency limit and the priority
level's configured nominal concurrency shares.
Maturity level ALPHA
apiserver_current_inqueue_requests is a gauge vector of recent
high water marks of the number of queued requests, grouped by a
label named request_kind whose value is mutating or readOnly.
These high water marks describe the largest number seen in the one
second window most recently completed. These complement the older
apiserver_current_inflight_requests gauge vector that holds the
last window's high water mark of number of requests actively being
served.
apiserver_current_inqueue_seats is a gauge vector of the sum over
queued requests of the largest number of seats each will occupy,
grouped by labels named flow_schema and priority_level.
apiserver_flowcontrol_read_vs_write_current_requests is a
histogram vector of observations, made at the end of every
nanosecond, of the number of requests broken down by the labels
phase (which takes on the values waiting and executing) and
request_kind (which takes on the values mutating and
readOnly). Each observed value is a ratio, between 0 and 1, of
the number of requests divided by the corresponding limit on the
number of requests (queue volume limit for waiting and concurrency
limit for executing).
apiserver_flowcontrol_request_concurrency_in_use is a gauge vector
holding the instantaneous number of occupied seats, broken down by
priority_level and flow_schema.
apiserver_flowcontrol_priority_level_request_utilization is a
histogram vector of observations, made at the end of each
nanosecond, of the number of requests broken down by the labels
phase (which takes on the values waiting and executing) and
priority_level. Each observed value is a ratio, between 0 and 1,
of a number of requests divided by the corresponding limit on the
number of requests (queue volume limit for waiting and concurrency
limit for executing).
apiserver_flowcontrol_priority_level_seat_utilization is a
histogram vector of observations, made at the end of each
nanosecond, of the utilization of a priority level's concurrency
limit, broken down by priority_level. This utilization is the
fraction (number of seats occupied) / (concurrency limit). This
metric considers all stages of execution (both normal and the extra
delay at the end of a write to cover for the corresponding
notification work) of all requests except WATCHes; for those it
considers only the initial stage that delivers notifications of
pre-existing objects. Each histogram in the vector is also labeled
with phase: executing (there is no seat limit for the waiting
phase).
apiserver_flowcontrol_request_queue_length_after_enqueue is a
histogram vector of queue lengths for the queues, broken down by
priority_level and flow_schema, as sampled by the enqueued requests.
Each request that gets queued contributes one sample to its histogram,
reporting the length of the queue immediately after the request was added.
Note that this produces different statistics than an unbiased survey would.
Note:
An outlier value in a histogram here means it is likely that a single flow
(i.e., requests by one user or for one namespace, depending on
configuration) is flooding the API server, and being throttled. By contrast,
if one priority level's histogram shows that all queues for that priority
level are longer than those for other priority levels, it may be appropriate
to increase that PriorityLevelConfiguration's concurrency shares.
apiserver_flowcontrol_request_concurrency_limit is the same as
apiserver_flowcontrol_nominal_limit_seats. Before the
introduction of concurrency borrowing between priority levels,
this was always equal to apiserver_flowcontrol_current_limit_seats
(which did not exist as a distinct metric).
apiserver_flowcontrol_lower_limit_seats is a gauge vector holding
the lower bound on each priority level's dynamic concurrency limit.
apiserver_flowcontrol_upper_limit_seats is a gauge vector holding
the upper bound on each priority level's dynamic concurrency limit.
apiserver_flowcontrol_demand_seats is a histogram vector counting
observations, at the end of every nanosecond, of each priority
level's ratio of (seat demand) / (nominal concurrency limit).
A priority level's seat demand is the sum, over both queued requests
and those in the initial phase of execution, of the maximum of the
number of seats occupied in the request's initial and final
execution phases.
apiserver_flowcontrol_demand_seats_high_watermark is a gauge vector
holding, for each priority level, the maximum seat demand seen
during the last concurrency borrowing adjustment period.
apiserver_flowcontrol_demand_seats_average is a gauge vector
holding, for each priority level, the time-weighted average seat
demand seen during the last concurrency borrowing adjustment period.
apiserver_flowcontrol_demand_seats_stdev is a gauge vector
holding, for each priority level, the time-weighted population
standard deviation of seat demand seen during the last concurrency
borrowing adjustment period.
apiserver_flowcontrol_demand_seats_smoothed is a gauge vector
holding, for each priority level, the smoothed enveloped seat demand
determined at the last concurrency adjustment.
apiserver_flowcontrol_target_seats is a gauge vector holding, for
each priority level, the concurrency target going into the borrowing
allocation problem.
apiserver_flowcontrol_seat_fair_frac is a gauge holding the fair
allocation fraction determined in the last borrowing adjustment.
apiserver_flowcontrol_current_limit_seats is a gauge vector
holding, for each priority level, the dynamic concurrency limit
derived in the last adjustment.
apiserver_flowcontrol_request_execution_seconds is a histogram
vector of how long requests took to actually execute, broken down by
flow_schema and priority_level.
apiserver_flowcontrol_watch_count_samples is a histogram vector of
the number of active WATCH requests relevant to a given write,
broken down by flow_schema and priority_level.
apiserver_flowcontrol_work_estimated_seats is a histogram vector
of the number of estimated seats (maximum of initial and final stage
of execution) associated with requests, broken down by flow_schema
and priority_level.
apiserver_flowcontrol_request_dispatch_no_accommodation_total is a
counter vector of the number of events that in principle could have led
to a request being dispatched but did not, due to lack of available
concurrency, broken down by flow_schema and priority_level.
apiserver_flowcontrol_epoch_advance_total is a counter vector of
the number of attempts to jump a priority level's progress meter
backward to avoid numeric overflow, grouped by priority_level and
success.
Good practices for using API Priority and Fairness
When a given priority level exceeds its permitted concurrency, requests can
experience increased latency or be dropped with an HTTP 429 (Too Many Requests)
error. To prevent these side effects of APF, you can modify your workload or
tweak your APF settings to ensure there are sufficient seats available to serve
your requests.
To detect whether requests are being rejected due to APF, check the following
metrics:
apiserver_flowcontrol_rejected_requests_total: the total number of requests
rejected per FlowSchema and PriorityLevelConfiguration.
apiserver_flowcontrol_current_inqueue_requests: the current number of requests
queued per FlowSchema and PriorityLevelConfiguration.
apiserver_flowcontrol_request_wait_duration_seconds: the latency added to
requests waiting in queues.
apiserver_flowcontrol_priority_level_seat_utilization: the seat utilization
per PriorityLevelConfiguration.
Workload modifications
To prevent requests from queuing and adding latency or being dropped due to APF,
you can optimize your requests by:
Reducing the rate at which requests are executed. A fewer number of requests
over a fixed period will result in a fewer number of seats being needed at a
given time.
Avoid issuing a large number of expensive requests concurrently. Requests can
be optimized to use fewer seats or have lower latency so that these requests
hold those seats for a shorter duration. List requests can occupy more than 1
seat depending on the number of objects fetched during the request. Restricting
the number of objects retrieved in a list request, for example by using
pagination, will use less total seats over a shorter period. Furthermore,
replacing list requests with watch requests will require lower total concurrency
shares as watch requests only occupy 1 seat during its initial burst of
notifications. If using streaming lists in versions 1.27 and later, watch
requests will occupy the same number of seats as a list request for its initial
burst of notifications because the entire state of the collection has to be
streamed. Note that in both cases, a watch request will not hold any seats after
this initial phase.
Keep in mind that queuing or rejected requests from APF could be induced by
either an increase in the number of requests or an increase in latency for
existing requests. For example, if requests that normally take 1s to execute
start taking 60s, it is possible that APF will start rejecting requests because
requests are occupying seats for a longer duration than normal due to this
increase in latency. If APF starts rejecting requests across multiple priority
levels without a significant change in workload, it is possible there is an
underlying issue with control plane performance rather than the workload or APF
settings.
Priority and fairness settings
You can also modify the default FlowSchema and PriorityLevelConfiguration
objects or create new objects of these types to better accommodate your
workload.
APF settings can be modified to:
Give more seats to high priority requests.
Isolate non-essential or expensive requests that would starve a concurrency
level if it was shared with other flows.
Give more seats to high priority requests
If possible, the number of seats available across all priority levels for a
particular kube-apiserver can be increased by increasing the values for the
max-requests-inflight and max-mutating-requests-inflight flags. Alternatively,
horizontally scaling the number of kube-apiserver instances will increase the
total concurrency per priority level across the cluster assuming there is
sufficient load balancing of requests.
You can create a new FlowSchema which references a PriorityLevelConfiguration
with a larger concurrency level. This new PriorityLevelConfiguration could be an
existing level or a new level with its own set of nominal concurrency shares.
For example, a new FlowSchema could be introduced to change the
PriorityLevelConfiguration for your requests from global-default to workload-low
to increase the number of seats available to your user. Creating a new
PriorityLevelConfiguration will reduce the number of seats designated for
existing levels. Recall that editing a default FlowSchema or
PriorityLevelConfiguration will require setting the
apf.kubernetes.io/autoupdate-spec annotation to false.
You can also increase the NominalConcurrencyShares for the
PriorityLevelConfiguration which is serving your high priority requests.
Alternatively, for versions 1.26 and later, you can increase the LendablePercent
for competing priority levels so that the given priority level has a higher pool
of seats it can borrow.
Isolate non-essential requests from starving other flows
For request isolation, you can create a FlowSchema whose subject matches the
user making these requests or create a FlowSchema that matches what the request
is (corresponding to the resourceRules). Next, you can map this FlowSchema to a
PriorityLevelConfiguration with a low share of seats.
For example, suppose list event requests from Pods running in the default namespace
are using 10 seats each and execute for 1 minute. To prevent these expensive
requests from impacting requests from other Pods using the existing service-accounts
FlowSchema, you can apply the following FlowSchema to isolate these list calls
from other requests.
Example FlowSchema object to isolate list event requests:
This FlowSchema captures all list event calls made by the default service
account in the default namespace. The matching precedence 8000 is lower than the
value of 9000 used by the existing service-accounts FlowSchema so these list
event calls will match list-events-default-service-account rather than
service-accounts.
The catch-all PriorityLevelConfiguration is used to isolate these requests.
The catch-all priority level has a very small concurrency share and does not
queue requests.
What's next
You can visit flow control reference doc to learn more about troubleshooting.
For background information on design details for API priority and fairness, see
the enhancement proposal.
Note: This section links to third party projects that provide functionality required by Kubernetes. The Kubernetes project authors aren't responsible for these projects, which are listed alphabetically. To add a project to this list, read the content guide before submitting a change. More information.
Add-ons extend the functionality of Kubernetes.
This page lists some of the available add-ons and links to their respective
installation instructions. The list does not try to be exhaustive.
Networking and Network Policy
ACI provides integrated
container networking and network security with Cisco ACI.
Antrea operates at Layer 3/4 to provide networking and
security services for Kubernetes, leveraging Open vSwitch as the networking
data plane. Antrea is a CNCF project at the Sandbox level.
Calico is a networking and network
policy provider. Calico supports a flexible set of networking options so you
can choose the most efficient option for your situation, including non-overlay
and overlay networks, with or without BGP. Calico uses the same engine to
enforce network policy for hosts, pods, and (if using Istio & Envoy)
applications at the service mesh layer.
Canal
unites Flannel and Calico, providing networking and network policy.
Cilium is a networking, observability,
and security solution with an eBPF-based data plane. Cilium provides a
simple flat Layer 3 network with the ability to span multiple clusters
in either a native routing or overlay/encapsulation mode, and can enforce
network policies on L3-L7 using an identity-based security model that is
decoupled from network addressing. Cilium can act as a replacement for
kube-proxy; it also offers additional, opt-in observability and security features.
Cilium is a CNCF project at the Graduated level.
CNI-Genie enables Kubernetes to seamlessly
connect to a choice of CNI plugins, such as Calico, Canal, Flannel, or Weave.
CNI-Genie is a CNCF project at the Sandbox level.
Contiv provides configurable networking (native L3 using BGP,
overlay using vxlan, classic L2, and Cisco-SDN/ACI) for various use cases and a rich
policy framework. Contiv project is fully open sourced.
The installer provides both kubeadm and
non-kubeadm based installation options.
Contrail,
based on Tungsten Fabric, is an open source, multi-cloud
network virtualization and policy management platform. Contrail and Tungsten
Fabric are integrated with orchestration systems such as Kubernetes, OpenShift,
OpenStack and Mesos, and provide isolation modes for virtual machines, containers/pods
and bare metal workloads.
Flannel is
an overlay network provider that can be used with Kubernetes.
Gateway API is an open source project managed by
the SIG Network community and
provides an expressive, extensible, and role-oriented API for modeling service networking.
Knitter is a plugin to support multiple network
interfaces in a Kubernetes pod.
kube-router is an open
source turnkey solution for Kubernetes networking with the aim to provide
operational simplicity and high performance. It leverages the Kubernetes API,
BGP, and Golang for the control path and Linux networking primitives (IPVS,
nftables, etc.) for the data path. It provides a low overhead alternative and
is used in both k0s and k3s.
Multus is a Multi plugin for
multiple network support in Kubernetes to support all CNI plugins
(e.g. Calico, Cilium, Contiv, Flannel), in addition to SRIOV, DPDK, OVS-DPDK and
VPP based workloads in Kubernetes.
OVN-Kubernetes is a networking
provider for Kubernetes based on OVN (Open Virtual Network),
a virtual networking implementation that came out of the Open vSwitch (OVS) project.
OVN-Kubernetes provides an overlay based networking implementation for Kubernetes,
including an OVS based implementation of load balancing and network policy.
Nodus is an OVN based CNI
controller plugin to provide cloud native based Service function chaining(SFC).
NSX-T Container Plug-in (NCP)
provides integration between VMware NSX-T and container orchestrators such as
Kubernetes, as well as integration between NSX-T and container-based CaaS/PaaS
platforms such as Pivotal Container Service (PKS) and OpenShift.
Nuage
is an SDN platform that provides policy-based networking between Kubernetes
Pods and non-Kubernetes environments with visibility and security monitoring.
Romana is a Layer 3 networking solution for pod
networks that also supports the NetworkPolicy API.
Spiderpool is an underlay and RDMA
networking solution for Kubernetes. Spiderpool is supported on bare metal, virtual machines,
and public cloud environments.
Terway is a suite of CNI plugins
based on AlibabaCloud's VPC and ECS network products. It provides native VPC networking
and network policies in AlibabaCloud environments.
Weave Net
provides networking and network policy, will carry on working on both sides
of a network partition, and does not require an external database.
Service Discovery
CoreDNS is a flexible, extensible DNS server which can
be installed
as the in-cluster DNS for pods.
Visualization & Control
Dashboard
is a dashboard web interface for Kubernetes.
Headlamp is an extensible Kubernetes UI that can be
deployed in-cluster or used as a desktop application.
Infrastructure
KubeVirt is an add-on
to run virtual machines on Kubernetes. Usually run on bare-metal clusters.
There are several other add-ons documented in the deprecated
cluster/addons directory.
Well-maintained ones should be linked to here. PRs welcome!
18 - Coordinated Leader Election
FEATURE STATE:Kubernetes v1.33 [beta](disabled by default)
Kubernetes 1.36 includes a beta feature that allows control plane components to
deterministically select a leader via coordinated leader election.
This is useful to satisfy Kubernetes version skew constraints during cluster upgrades.
Currently, the only builtin selection strategy is OldestEmulationVersion,
preferring the leader with the lowest emulation version, followed by binary
version, followed by creation timestamp.
Enabling coordinated leader election
Ensure that CoordinatedLeaderElectionfeature
gate is enabled
when you start the API Server: and that the coordination.k8s.io/v1beta1 API group is
enabled.
This can be done by setting flags --feature-gates="CoordinatedLeaderElection=true" and
--runtime-config="coordination.k8s.io/v1beta1=true".
Component configuration
Provided that you have enabled the CoordinatedLeaderElection feature gate and have the coordination.k8s.io/v1beta1 API group enabled, compatible control plane components automatically use the LeaseCandidate and Lease APIs to elect a leader as needed.
For Kubernetes 1.36, two control plane components (kube-controller-manager and kube-scheduler) automatically use coordinated leader election when the feature gate and API group are enabled.
Leader selection for Kubernetes components
Kubernetes uses the Lease API to perform leader election among multiple instances of the same control-plane component in a high-availability cluster, such as kube-controller-manager or kube-scheduler.
A Lease acts as a lightweight distributed lock. stored by the Kubernetes API server.
All running instances of a component watch or periodically read the relevant Lease object
to determine which instance is currently acting as the leader.
the identity (for example: pod name or hostname-based string) of the current leader.
acquireTime
timestamp when leadership was acquired.
renewTime
timestamp of the most recent renewal by the leader.
leaseDurationSeconds
the validity period of the lease (candidates should wait this long plus a small grace period before attempting to acquire an expired lease).
leaseTransitions
counter of how many times leadership has changed hands.
These fields indicate which instance holds leadership and how long that leadership remains valid.
When the Lease does not exist or has expired (current time > renewTime + leaseDurationSeconds), candidate instances attempt to update the Lease with their identity. Kubernetes relies on optimistic concurrency control via the object's resourceVersion: only one update succeeds due to version mismatch on concurrent attempts. The instance whose update is accepted becomes the leader.
Kubernetes uses the LeaseCandidate
API to manage leader elections. Control plane components such as kube-controller-manager and kube-scheduler register their role as a candidate by creating LeaseCandidate objects, which track all instances competing for leadership and carry metadata including the candidate's identity, binary version, and emulation version.
During an election, candidates coordinate through a shared Lease.
The Kubernetes control plane guarantees that only one candidate successfully acquires the Lease and assumes the role of leader, while all others remain as followers. If the current leader fails to renew the Lease within the selected timeout period, the remaining candidates compete to acquire leadership and elect a new leader.
Once elected, the leader periodically renews its Lease by updating the renewTime field
(for example, performing renewal every leaseDurationSeconds ÷ 2, in order to avoid conflicts when the Lease is about to expire).
As long as renewals occur before the lease expires, the current leader instance retains leadership.
If the leader crashes, becomes unreachable, or stops renewing the Lease, that Lease expires. Other healthy instances detect the expired Lease and attempt a new election.
This mechanism ensures that even though multiple replicas of a component may be running for stability and recovery, only one instance actively performs control tasks at a time, while the others remain on standby, watching the Lease and ready to take over quickly if needed.