This is the multi-page printable view of this section. Click here to print.
Access Applications in a Cluster
- 1: Deploy and Access the Kubernetes Dashboard
- 2: Accessing Clusters
- 3: Configure Access to Multiple Clusters
- 4: Use Port Forwarding to Access Applications in a Cluster
- 5: Use a Service to Access an Application in a Cluster
- 6: Connect a Frontend to a Backend Using Services
- 7: Create an External Load Balancer
- 8: List All Container Images Running in a Cluster
- 9: Communicate Between Containers in the Same Pod Using a Shared Volume
- 10: Configure DNS for a Cluster
- 11: Access Services Running on Clusters
1 - Deploy and Access the Kubernetes Dashboard
Kubernetes Dashboard is deprecated and unmaintained.
The Kubernetes Dashboard project has been archived and is no longer actively maintained. For new installations, consider using Headlamp.
Note:
For in-cluster deployments similar to Kubernetes Dashboard, see the Headlamp in-cluster installation guide.Dashboard is a web-based Kubernetes user interface. You can use Dashboard to deploy containerized applications to a Kubernetes cluster, troubleshoot your containerized application, and manage the cluster resources. You can use Dashboard to get an overview of applications running on your cluster, as well as for creating or modifying individual Kubernetes resources (such as Deployments, Jobs, DaemonSets, etc). For example, you can scale a Deployment, initiate a rolling update, restart a pod or deploy new applications using a deploy wizard.
Dashboard also provides information on the state of Kubernetes resources in your cluster and on any errors that may have occurred.
Deploying the Dashboard UI
Note:
Kubernetes Dashboard supports only Helm-based installation currently as it is faster and gives us better control over all dependencies required by Dashboard to run.The Dashboard UI is not deployed by default. To deploy it, run the following command:
# Add kubernetes-dashboard repository
helm repo add kubernetes-dashboard https://kubernetes.github.io/dashboard/
# Deploy a Helm Release named "kubernetes-dashboard" using the kubernetes-dashboard chart
helm upgrade --install kubernetes-dashboard kubernetes-dashboard/kubernetes-dashboard --create-namespace --namespace kubernetes-dashboard
Accessing the Dashboard UI
To protect your cluster data, Dashboard deploys with a minimal RBAC configuration by default. Currently, Dashboard only supports logging in with a Bearer Token. To create a token for this demo, you can follow our guide on creating a sample user.
Warning:
The sample user created in the tutorial will have administrative privileges and is for educational purposes only.Command line proxy
You can enable access to the Dashboard using the kubectl command-line tool,
by running the following command:
kubectl -n kubernetes-dashboard port-forward svc/kubernetes-dashboard-kong-proxy 8443:443
Kubectl will make Dashboard available at https://localhost:8443.
The UI can only be accessed from the machine where the command is executed. See kubectl port-forward --help for more options.
Note:
The kubeconfig authentication method does not support external identity providers or X.509 certificate-based authentication.Welcome view
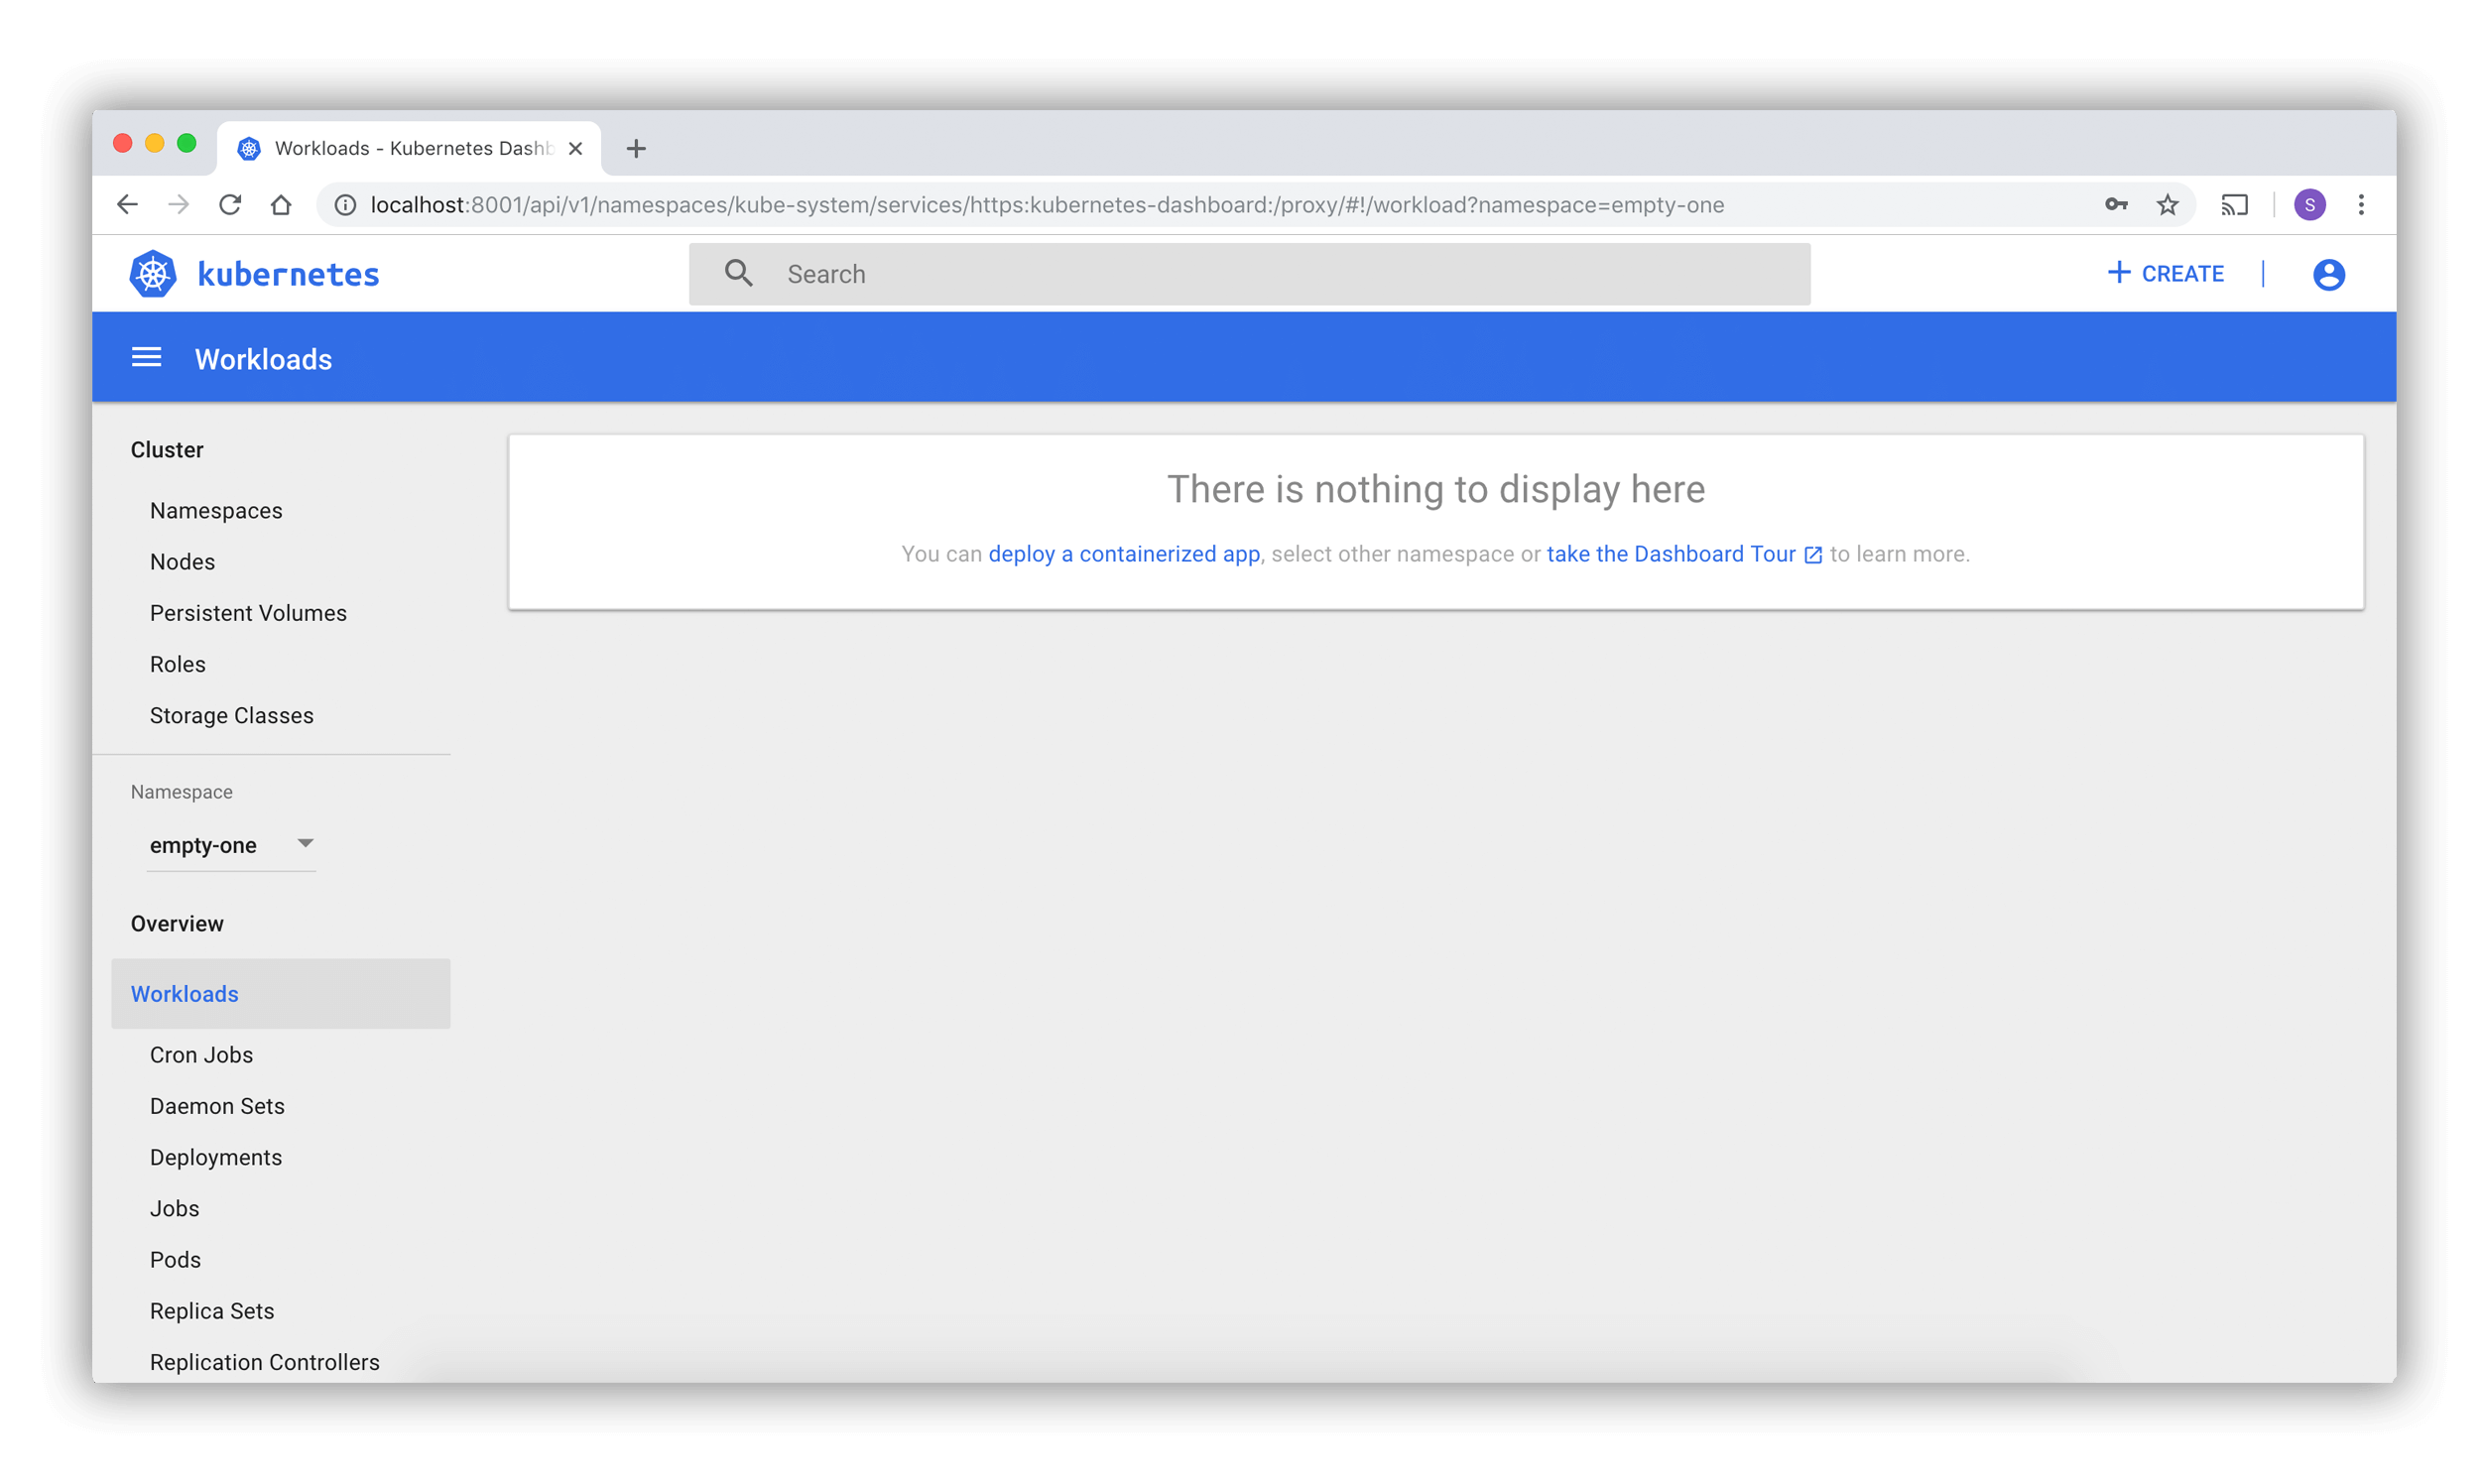
When you access Dashboard on an empty cluster, you'll see the welcome page.
This page contains a link to this document as well as a button to deploy your first application.
In addition, you can view which system applications are running by default in the kube-system
namespace of your cluster, for example the Dashboard itself.
Deploying containerized applications
Dashboard lets you create and deploy a containerized application as a Deployment and optional Service with a simple wizard. You can either manually specify application details, or upload a YAML or JSON manifest file containing application configuration.
Click the CREATE button in the upper right corner of any page to begin.
Specifying application details
The deploy wizard expects that you provide the following information:
App name (mandatory): Name for your application. A label with the name will be added to the Deployment and Service, if any, that will be deployed.
The application name must be unique within the selected Kubernetes namespace. It must start with a lowercase character, and end with a lowercase character or a number, and contain only lowercase letters, numbers and dashes (-). It is limited to 24 characters. Leading and trailing spaces are ignored.
Container image (mandatory): The URL of a public Docker container image on any registry, or a private image (commonly hosted on the Google Container Registry or Docker Hub). The container image specification must end with a colon.
Number of pods (mandatory): The target number of Pods you want your application to be deployed in. The value must be a positive integer.
A Deployment will be created to maintain the desired number of Pods across your cluster.
Service (optional): For some parts of your application (e.g. frontends) you may want to expose a Service onto an external, maybe public IP address outside of your cluster (external Service).
Note:
For external Services, you may need to open up one or more ports to do so.Other Services that are only visible from inside the cluster are called internal Services.
Irrespective of the Service type, if you choose to create a Service and your container listens on a port (incoming), you need to specify two ports. The Service will be created mapping the port (incoming) to the target port seen by the container. This Service will route to your deployed Pods. Supported protocols are TCP and UDP. The internal DNS name for this Service will be the value you specified as application name above.
If needed, you can expand the Advanced options section where you can specify more settings:
Description: The text you enter here will be added as an annotation to the Deployment and displayed in the application's details.
Labels: Default labels to be used for your application are application name and version. You can specify additional labels to be applied to the Deployment, Service (if any), and Pods, such as release, environment, tier, partition, and release track.
Example:
release=1.0 tier=frontend environment=pod track=stableNamespace: Kubernetes supports multiple virtual clusters backed by the same physical cluster. These virtual clusters are called namespaces. They let you partition resources into logically named groups.
Dashboard offers all available namespaces in a dropdown list, and allows you to create a new namespace. The namespace name may contain a maximum of 63 alphanumeric characters and dashes (-) but can not contain capital letters. Namespace names should not consist of only numbers. If the name is set as a number, such as 10, the pod will be put in the default namespace.
In case the creation of the namespace is successful, it is selected by default. If the creation fails, the first namespace is selected.
Image Pull Secret: In case the specified Docker container image is private, it may require pull secret credentials.
Dashboard offers all available secrets in a dropdown list, and allows you to create a new secret. The secret name must follow the DNS domain name syntax, for example
new.image-pull.secret. The content of a secret must be base64-encoded and specified in a.dockercfgfile. The secret name may consist of a maximum of 253 characters.In case the creation of the image pull secret is successful, it is selected by default. If the creation fails, no secret is applied.
CPU requirement (cores) and Memory requirement (MiB): You can specify the minimum resource limits for the container. By default, Pods run with unbounded CPU and memory limits.
Run command and Run command arguments: By default, your containers run the specified Docker image's default entrypoint command. You can use the command options and arguments to override the default.
Run as privileged: This setting determines whether processes in privileged containers are equivalent to processes running as root on the host. Privileged containers can make use of capabilities like manipulating the network stack and accessing devices.
Environment variables: Kubernetes exposes Services through environment variables. You can compose environment variable or pass arguments to your commands using the values of environment variables. They can be used in applications to find a Service. Values can reference other variables using the
$(VAR_NAME)syntax.
Uploading a YAML or JSON file
Kubernetes supports declarative configuration. In this style, all configuration is stored in manifests (YAML or JSON configuration files). The manifests use Kubernetes API resource schemas.
As an alternative to specifying application details in the deploy wizard, you can define your application in one or more manifests, and upload the files using Dashboard.
Using Dashboard
Following sections describe views of the Kubernetes Dashboard UI; what they provide and how can they be used.
Navigation
When there are Kubernetes objects defined in the cluster, Dashboard shows them in the initial view. By default only objects from the default namespace are shown and this can be changed using the namespace selector located in the navigation menu.
Dashboard shows most Kubernetes object kinds and groups them in a few menu categories.
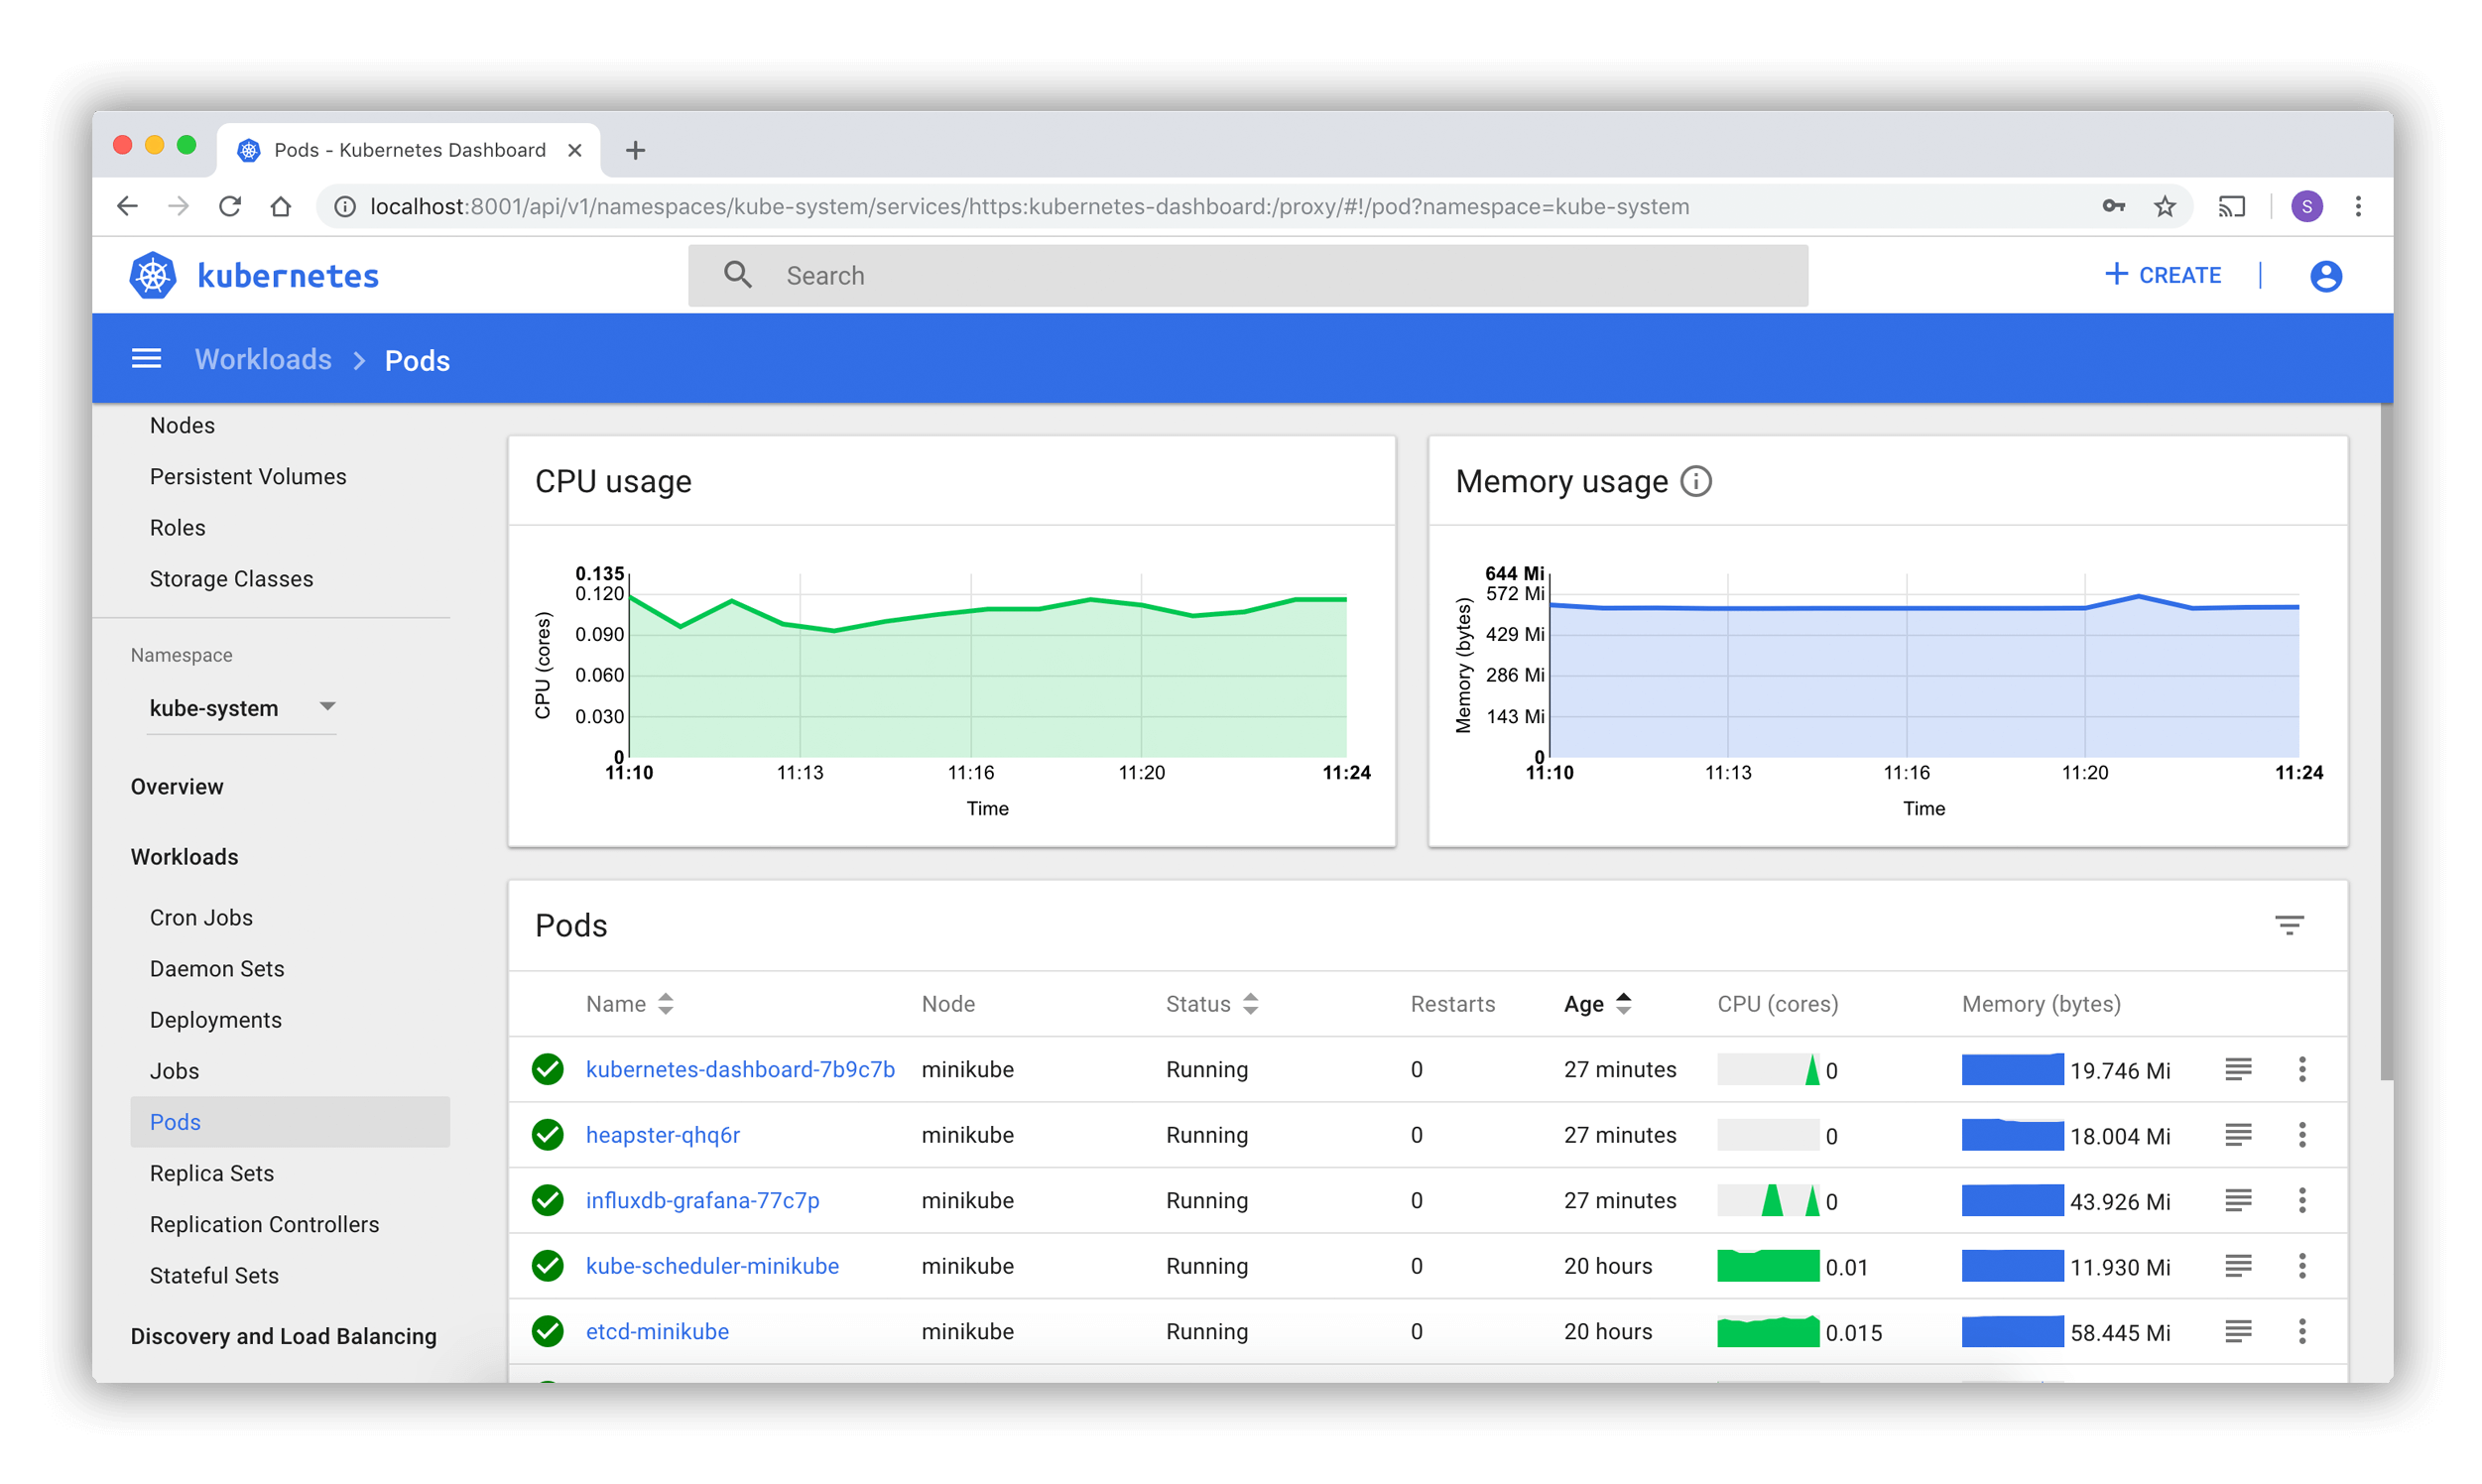
Admin overview
For cluster and namespace administrators, Dashboard lists Nodes, Namespaces and PersistentVolumes and has detail views for them. Node list view contains CPU and memory usage metrics aggregated across all Nodes. The details view shows the metrics for a Node, its specification, status, allocated resources, events and pods running on the node.
Workloads
Shows all applications running in the selected namespace. The view lists applications by workload kind (for example: Deployments, ReplicaSets, StatefulSets). Each workload kind can be viewed separately. The lists summarize actionable information about the workloads, such as the number of ready pods for a ReplicaSet or current memory usage for a Pod.
Detail views for workloads show status and specification information and surface relationships between objects. For example, Pods that ReplicaSet is controlling or new ReplicaSets and HorizontalPodAutoscalers for Deployments.
Services
Shows Kubernetes resources that allow for exposing services to external world and discovering them within a cluster. For that reason, Service and Ingress views show Pods targeted by them, internal endpoints for cluster connections and external endpoints for external users.
Storage
Storage view shows PersistentVolumeClaim resources which are used by applications for storing data.
ConfigMaps and Secrets
Shows all Kubernetes resources that are used for live configuration of applications running in clusters. The view allows for editing and managing config objects and displays secrets hidden by default.
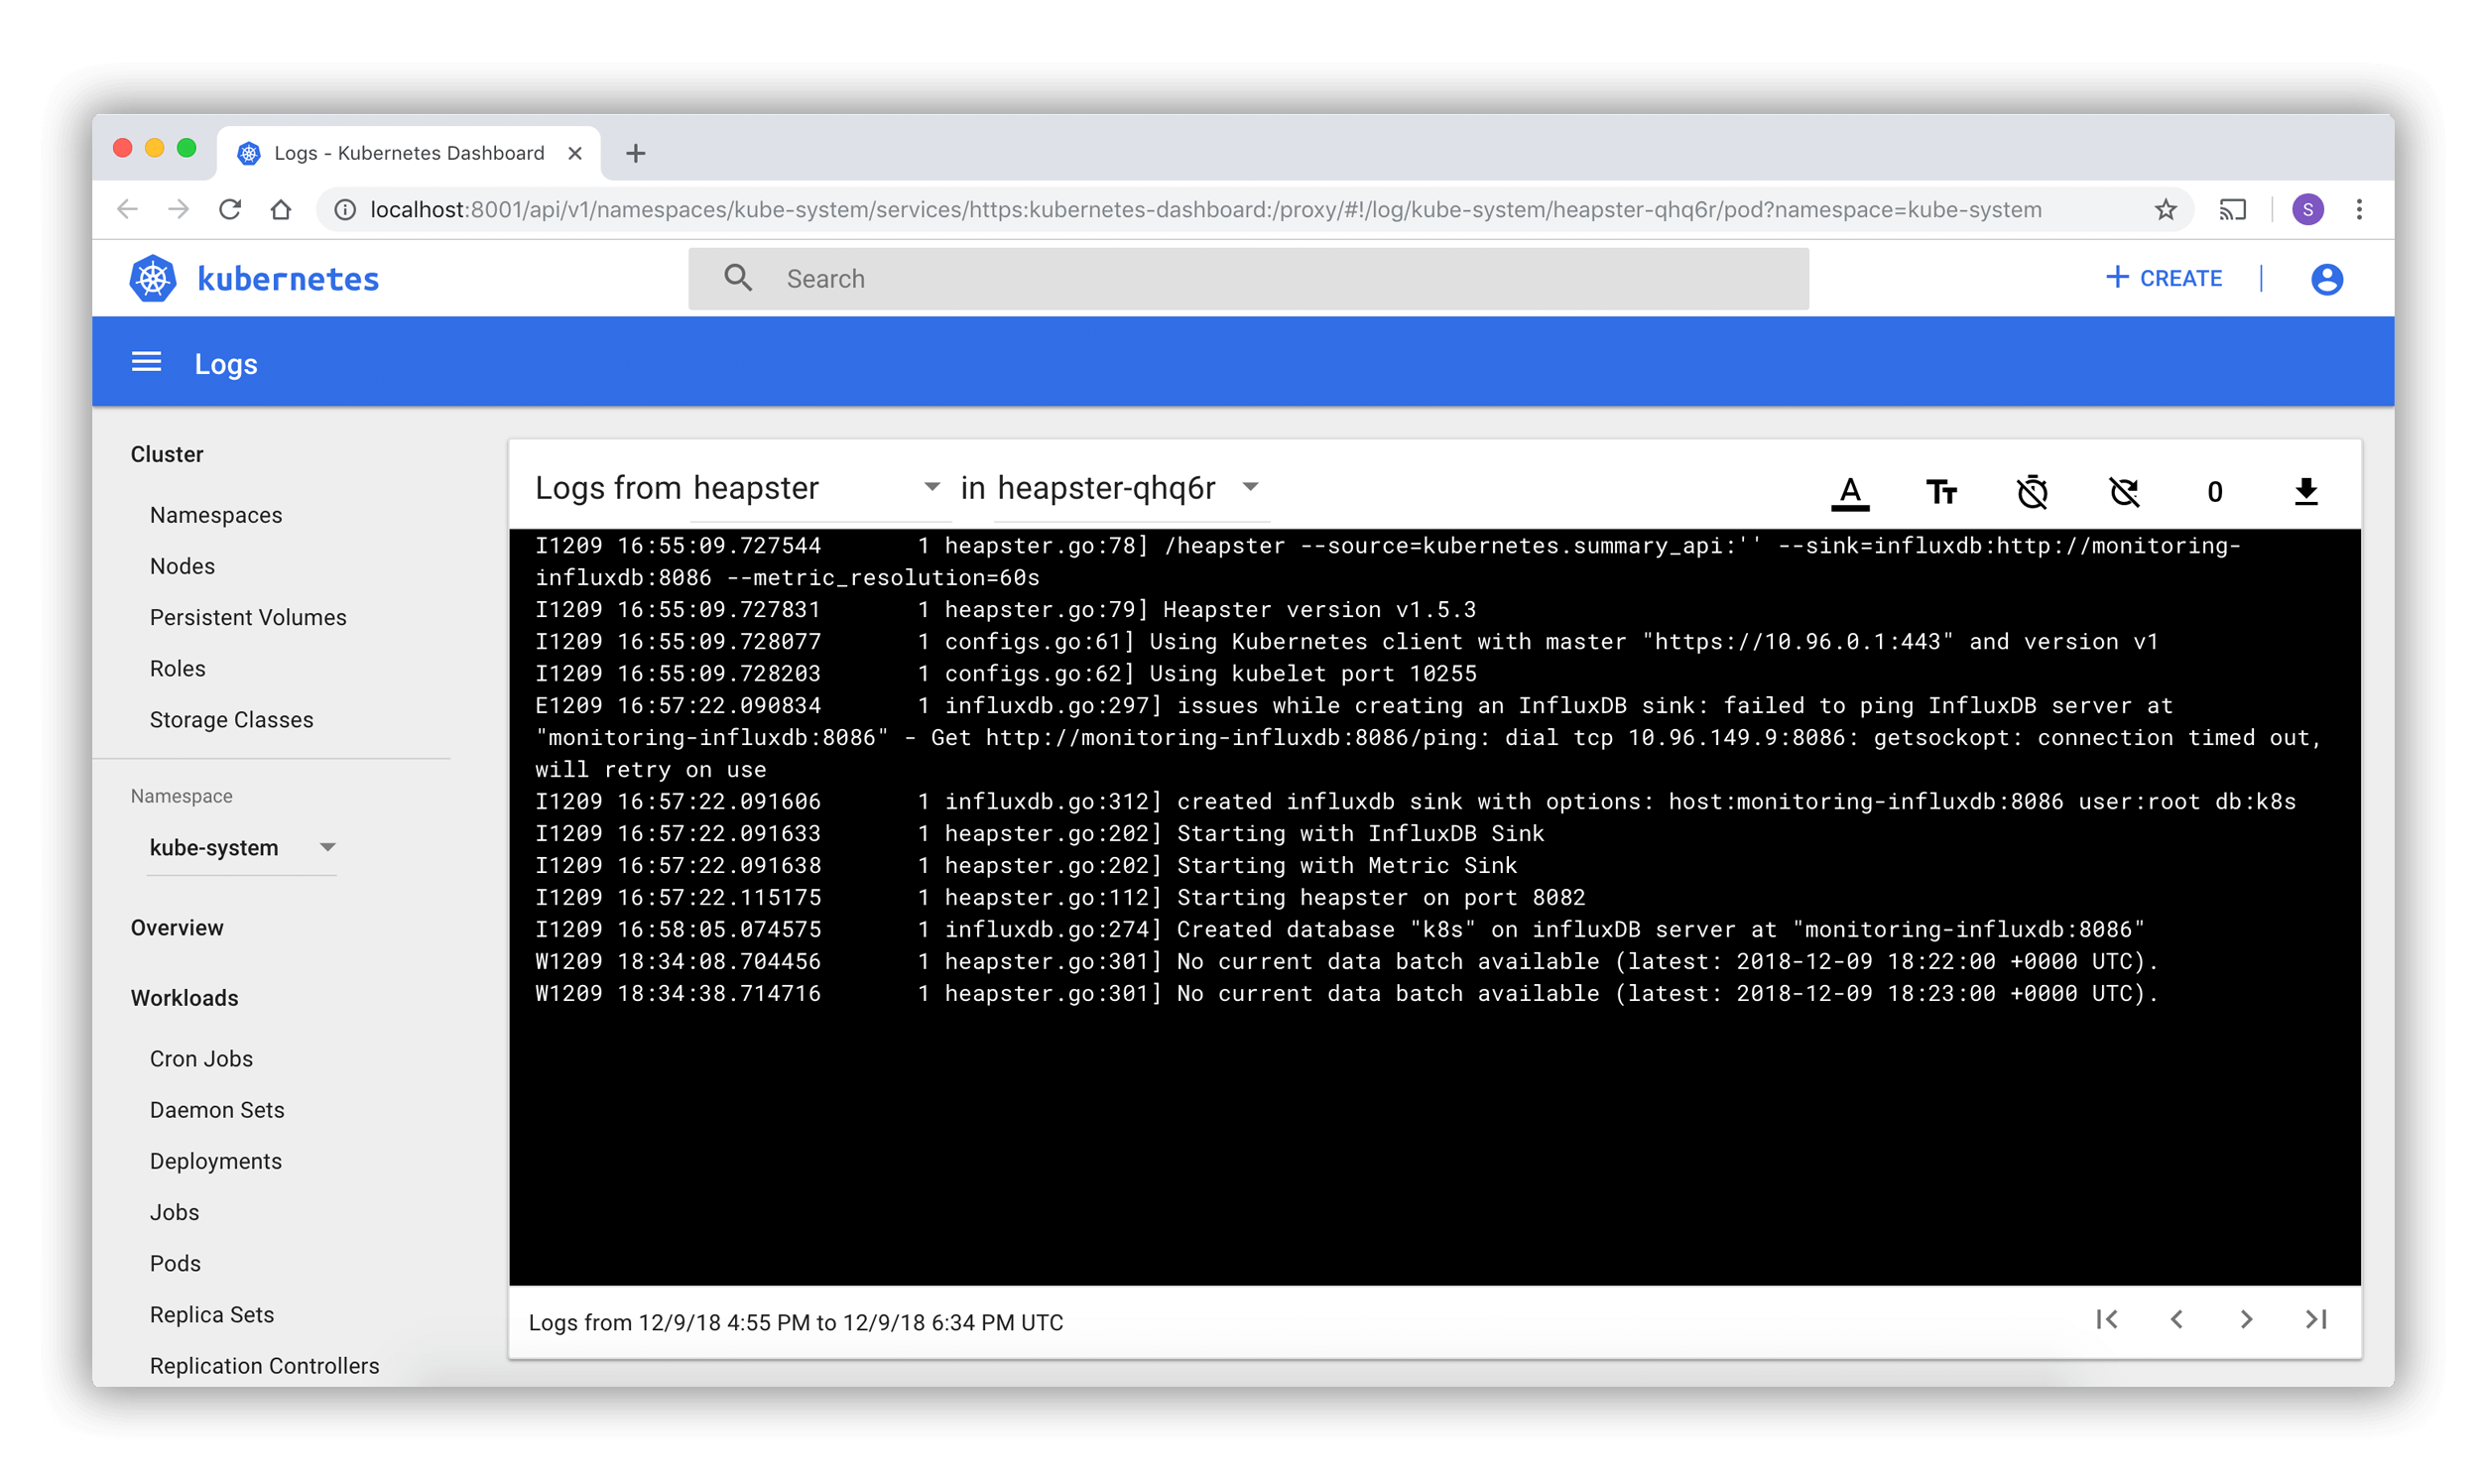
Logs viewer
Pod lists and detail pages link to a logs viewer that is built into Dashboard. The viewer allows for drilling down logs from containers belonging to a single Pod.
What's next
For more information, see the Kubernetes Dashboard project page.
2 - Accessing Clusters
This topic discusses multiple ways to interact with clusters.
Accessing for the first time with kubectl
When accessing the Kubernetes API for the first time, we suggest using the
Kubernetes CLI, kubectl.
To access a cluster, you need to know the location of the cluster and have credentials to access it. Typically, this is automatically set-up when you work through a Getting started guide, or someone else set up the cluster and provided you with credentials and a location.
Check the location and credentials that kubectl knows about with this command:
kubectl config view
Many of the examples provide an introduction to using
kubectl, and complete documentation is found in the
kubectl reference.
Directly accessing the REST API
Kubectl handles locating and authenticating to the apiserver. If you want to directly access the REST API with an http client like curl or wget, or a browser, there are several ways to locate and authenticate:
- Run kubectl in proxy mode.
- Recommended approach.
- Uses stored apiserver location.
- Verifies identity of apiserver using self-signed cert. No MITM possible.
- Authenticates to apiserver.
- In future, may do intelligent client-side load-balancing and failover.
- Provide the location and credentials directly to the http client.
- Alternate approach.
- Works with some types of client code that are confused by using a proxy.
- Need to import a root cert into your browser to protect against MITM.
Using kubectl proxy
The following command runs kubectl in a mode where it acts as a reverse proxy. It handles locating the apiserver and authenticating. Run it like this:
kubectl proxy --port=8080
See kubectl proxy for more details.
Then you can explore the API with curl, wget, or a browser, replacing localhost with [::1] for IPv6, like so:
curl http://localhost:8080/api/
The output is similar to this:
{
  "kind": "APIVersions",
  "versions": [
    "v1"
  ],
  "serverAddressByClientCIDRs": [
    {
      "clientCIDR": "0.0.0.0/0",
      "serverAddress": "10.0.1.149:443"
    }
  ]
}
Without kubectl proxy
Use kubectl apply and kubectl describe secret... to create a token for the default service account with grep/cut:
First, create the Secret, requesting a token for the default ServiceAccount:
kubectl apply -f - <<EOF
apiVersion: v1
kind: Secret
metadata:
  name: default-token
  annotations:
    kubernetes.io/service-account.name: default
type: kubernetes.io/service-account-token
EOF
Next, wait for the token controller to populate the Secret with a token:
while ! kubectl describe secret default-token | grep -E '^token' >/dev/null; do
  echo "waiting for token..." >&2
  sleep 1
done
Capture and use the generated token:
APISERVER=$(kubectl config view --minify | grep server | cut -f 2- -d ":" | tr -d " ")
TOKEN=$(kubectl describe secret default-token | grep -E '^token' | cut -f2 -d':' | tr -d " ")

curl $APISERVER/api --header "Authorization: Bearer $TOKEN" --insecure
The output is similar to this:
{
  "kind": "APIVersions",
  "versions": [
    "v1"
  ],
  "serverAddressByClientCIDRs": [
    {
      "clientCIDR": "0.0.0.0/0",
      "serverAddress": "10.0.1.149:443"
    }
  ]
}
Using jsonpath:
APISERVER=$(kubectl config view --minify -o jsonpath='{.clusters[0].cluster.server}')
TOKEN=$(kubectl get secret default-token -o jsonpath='{.data.token}' | base64 --decode)

curl $APISERVER/api --header "Authorization: Bearer $TOKEN" --insecure
The output is similar to this:
{
  "kind": "APIVersions",
  "versions": [
    "v1"
  ],
  "serverAddressByClientCIDRs": [
    {
      "clientCIDR": "0.0.0.0/0",
      "serverAddress": "10.0.1.149:443"
    }
  ]
}
The above examples use the --insecure flag. This leaves it subject to MITM
attacks. When kubectl accesses the cluster it uses a stored root certificate
and client certificates to access the server. (These are installed in the
~/.kube directory). Since cluster certificates are typically self-signed, it
may take special configuration to get your http client to use root
certificate.
On some clusters, the apiserver does not require authentication; it may serve on localhost, or be protected by a firewall. There is not a standard for this. Controlling Access to the API describes how a cluster admin can configure this.
Programmatic access to the API
Kubernetes officially supports Go and Python client libraries.
Go client
- To get the library, run the following command:
go get k8s.io/client-go@kubernetes-<kubernetes-version-number>, see INSTALL.md for detailed installation instructions. See https://github.com/kubernetes/client-go to see which versions are supported. - Write an application atop of the client-go clients. Note that client-go defines its own API objects,
so if needed, please import API definitions from client-go rather than from the main repository,
e.g.,
import "k8s.io/client-go/kubernetes"is correct.
The Go client can use the same kubeconfig file as the kubectl CLI does to locate and authenticate to the apiserver. See this example.
If the application is deployed as a Pod in the cluster, please refer to the next section.
Python client
To use Python client, run the following command:
pip install kubernetes. See Python Client Library page
for more installation options.
The Python client can use the same kubeconfig file as the kubectl CLI does to locate and authenticate to the apiserver. See this example.
Other languages
There are client libraries for accessing the API from other languages. See documentation for other libraries for how they authenticate.
Accessing the API from a Pod
When accessing the API from a pod, locating and authenticating to the API server are somewhat different.
Please check Accessing the API from within a Pod for more details.
Accessing services running on the cluster
The previous section describes how to connect to the Kubernetes API server. For information about connecting to other services running on a Kubernetes cluster, see Access Cluster Services.
Requesting redirects
The redirect capabilities have been deprecated and removed. Please use a proxy (see below) instead.
So many proxies
There are several different proxies you may encounter when using Kubernetes:
The kubectl proxy:
- runs on a user's desktop or in a pod
- proxies from a localhost address to the Kubernetes apiserver
- client to proxy uses HTTP
- proxy to apiserver uses HTTPS
- locates apiserver
- adds authentication headers
The apiserver proxy:
- is a bastion built into the apiserver
- connects a user outside of the cluster to cluster IPs which otherwise might not be reachable
- runs in the apiserver processes
- client to proxy uses HTTPS (or http if apiserver so configured)
- proxy to target may use HTTP or HTTPS as chosen by proxy using available information
- can be used to reach a Node, Pod, or Service
- does load balancing when used to reach a Service
The kube proxy:
- runs on each node
- proxies UDP and TCP
- does not understand HTTP
- provides load balancing
- is only used to reach services
A Proxy/Load-balancer in front of apiserver(s):
- existence and implementation varies from cluster to cluster (e.g. nginx)
- sits between all clients and one or more apiservers
- acts as load balancer if there are several apiservers.
Cloud Load Balancers on external services:
- are provided by some cloud providers (e.g. AWS ELB, Google Cloud Load Balancer)
- are created automatically when the Kubernetes service has type
LoadBalancer - use UDP/TCP only
- implementation varies by cloud provider.
Kubernetes users will typically not need to worry about anything other than the first two types. The cluster admin will typically ensure that the latter types are set up correctly.
3 - Configure Access to Multiple Clusters
This page shows how to configure access to multiple clusters by using
configuration files. After your clusters, users, and contexts are defined in
one or more configuration files, you can quickly switch between clusters by using the
kubectl config use-context command.
Note:
A file that is used to configure access to a cluster is sometimes called a kubeconfig file. This is a generic way of referring to configuration files. It does not mean that there is a file namedkubeconfig.Warning:
Only use kubeconfig files from trusted sources. Using a specially-crafted kubeconfig file could result in malicious code execution or file exposure. If you must use an untrusted kubeconfig file, inspect it carefully first, much as you would a shell script.Before you begin
You need to have a Kubernetes cluster, and the kubectl command-line tool must be configured to communicate with your cluster. It is recommended to run this tutorial on a cluster with at least two nodes that are not acting as control plane hosts. If you do not already have a cluster, you can create one by using minikube or you can use one of these Kubernetes playgrounds:
To check that kubectl is installed,
run kubectl version --client. The kubectl version should be
within one minor version of your
cluster's API server.
Define clusters, users, and contexts
Suppose you have two clusters, one for development work and one for test work.
In the development cluster, your frontend developers work in a namespace called frontend,
and your storage developers work in a namespace called storage. In your test cluster,
developers work in the default namespace, or they create auxiliary namespaces as they
see fit. Access to the development cluster requires authentication by certificate. Access
to the test cluster requires authentication by username and password.
Create a directory named config-exercise. In your
config-exercise directory, create a file named config-demo with this content:
apiVersion: v1
kind: Config
preferences: {}

clusters:
- cluster:
  name: development
- cluster:
  name: test

users:
- name: developer
- name: experimenter

contexts:
- context:
  name: dev-frontend
- context:
  name: dev-storage
- context:
  name: exp-test
A configuration file describes clusters, users, and contexts. Your config-demo file
has the framework to describe two clusters, two users, and three contexts.
Go to your config-exercise directory. Enter these commands to add cluster details to
your configuration file:
kubectl config --kubeconfig=config-demo set-cluster development --server=https://1.2.3.4 --certificate-authority=fake-ca-file
kubectl config --kubeconfig=config-demo set-cluster test --server=https://5.6.7.8 --insecure-skip-tls-verify
Add user details to your configuration file:
Caution:
Storing passwords in Kubernetes client config is risky. A better alternative would be to use a credential plugin and store them separately. See: client-go credential pluginskubectl config --kubeconfig=config-demo set-credentials developer --client-certificate=fake-cert-file --client-key=fake-key-seefile
kubectl config --kubeconfig=config-demo set-credentials experimenter --username=exp --password=some-password
Note:
- To delete a user you can run
kubectl --kubeconfig=config-demo config unset users.<name> - To remove a cluster, you can run
kubectl --kubeconfig=config-demo config unset clusters.<name> - To remove a context, you can run
kubectl --kubeconfig=config-demo config unset contexts.<name>
Add context details to your configuration file:
kubectl config --kubeconfig=config-demo set-context dev-frontend --cluster=development --namespace=frontend --user=developer
kubectl config --kubeconfig=config-demo set-context dev-storage --cluster=development --namespace=storage --user=developer
kubectl config --kubeconfig=config-demo set-context exp-test --cluster=test --namespace=default --user=experimenter
Open your config-demo file to see the added details. As an alternative to opening the
config-demo file, you can use the config view command.
kubectl config --kubeconfig=config-demo view
The output shows the two clusters, two users, and three contexts:
apiVersion: v1
clusters:
- cluster:
    certificate-authority: fake-ca-file
    server: https://1.2.3.4
  name: development
- cluster:
    insecure-skip-tls-verify: true
    server: https://5.6.7.8
  name: test
contexts:
- context:
    cluster: development
    namespace: frontend
    user: developer
  name: dev-frontend
- context:
    cluster: development
    namespace: storage
    user: developer
  name: dev-storage
- context:
    cluster: test
    namespace: default
    user: experimenter
  name: exp-test
current-context: ""
kind: Config
preferences: {}
users:
- name: developer
  user:
    client-certificate: fake-cert-file
    client-key: fake-key-file
- name: experimenter
  user:
    # Documentation note (this comment is NOT part of the command output).
    # Storing passwords in Kubernetes client config is risky.
    # A better alternative would be to use a credential plugin
    # and store the credentials separately.
    # See https://kubernetes.io/docs/reference/access-authn-authz/authentication/#client-go-credential-plugins
    password: some-password
    username: exp
The fake-ca-file, fake-cert-file and fake-key-file above are the placeholders
for the pathnames of the certificate files. You need to change these to the actual pathnames
of certificate files in your environment.
Sometimes you may want to use Base64-encoded data embedded here instead of separate
certificate files; in that case you need to add the suffix -data to the keys, for example,
certificate-authority-data, client-certificate-data, client-key-data.
Each context is a triple (cluster, user, namespace). For example, the
dev-frontend context says, "Use the credentials of the developer
user to access the frontend namespace of the development cluster".
Set the current context:
kubectl config --kubeconfig=config-demo use-context dev-frontend
Now whenever you enter a kubectl command, the action will apply to the cluster,
and namespace listed in the dev-frontend context. And the command will use
the credentials of the user listed in the dev-frontend context.
To see only the configuration information associated with
the current context, use the --minify flag.
kubectl config --kubeconfig=config-demo view --minify
The output shows configuration information associated with the dev-frontend context:
apiVersion: v1
clusters:
- cluster:
    certificate-authority: fake-ca-file
    server: https://1.2.3.4
  name: development
contexts:
- context:
    cluster: development
    namespace: frontend
    user: developer
  name: dev-frontend
current-context: dev-frontend
kind: Config
preferences: {}
users:
- name: developer
  user:
    client-certificate: fake-cert-file
    client-key: fake-key-file
Now suppose you want to work for a while in the test cluster.
Change the current context to exp-test:
kubectl config --kubeconfig=config-demo use-context exp-test
Now any kubectl command you give will apply to the default namespace of
the test cluster. And the command will use the credentials of the user
listed in the exp-test context.
View configuration associated with the new current context, exp-test.
kubectl config --kubeconfig=config-demo view --minify
Finally, suppose you want to work for a while in the storage namespace of the
development cluster.
Change the current context to dev-storage:
kubectl config --kubeconfig=config-demo use-context dev-storage
View configuration associated with the new current context, dev-storage.
kubectl config --kubeconfig=config-demo view --minify
Create a second configuration file
In your config-exercise directory, create a file named config-demo-2 with this content:
apiVersion: v1
kind: Config
preferences: {}

contexts:
- context:
    cluster: development
    namespace: ramp
    user: developer
  name: dev-ramp-up
The preceding configuration file defines a new context named dev-ramp-up.
Set the KUBECONFIG environment variable
See whether you have an environment variable named KUBECONFIG. If so, save the
current value of your KUBECONFIG environment variable, so you can restore it later.
For example:
Linux
export KUBECONFIG_SAVED="$KUBECONFIG"
Windows PowerShell
$Env:KUBECONFIG_SAVED=$ENV:KUBECONFIG
The KUBECONFIG environment variable is a list of paths to configuration files. The list is
colon-delimited for Linux and Mac, and semicolon-delimited for Windows. If you have
a KUBECONFIG environment variable, familiarize yourself with the configuration files
in the list.
Temporarily append two paths to your KUBECONFIG environment variable. For example:
Linux
export KUBECONFIG="${KUBECONFIG}:config-demo:config-demo-2"
Windows PowerShell
$Env:KUBECONFIG=("config-demo;config-demo-2")
In your config-exercise directory, enter this command:
kubectl config view
The output shows merged information from all the files listed in your KUBECONFIG
environment variable. In particular, notice that the merged information has the
dev-ramp-up context from the config-demo-2 file and the three contexts from
the config-demo file:
contexts:
- context:
    cluster: development
    namespace: frontend
    user: developer
  name: dev-frontend
- context:
    cluster: development
    namespace: ramp
    user: developer
  name: dev-ramp-up
- context:
    cluster: development
    namespace: storage
    user: developer
  name: dev-storage
- context:
    cluster: test
    namespace: default
    user: experimenter
  name: exp-test
For more information about how kubeconfig files are merged, see Organizing Cluster Access Using kubeconfig Files
Explore the $HOME/.kube directory
If you already have a cluster, and you can use kubectl to interact with
the cluster, then you probably have a file named config in the $HOME/.kube
directory.
Go to $HOME/.kube, and see what files are there. Typically, there is a file named
config. There might also be other configuration files in this directory. Briefly
familiarize yourself with the contents of these files.
Append $HOME/.kube/config to your KUBECONFIG environment variable
If you have a $HOME/.kube/config file, and it's not already listed in your
KUBECONFIG environment variable, append it to your KUBECONFIG environment variable now.
For example:
Linux
export KUBECONFIG="${KUBECONFIG}:${HOME}/.kube/config"
Windows Powershell
$Env:KUBECONFIG="$Env:KUBECONFIG;$HOME\.kube\config"
View configuration information merged from all the files that are now listed
in your KUBECONFIG environment variable. In your config-exercise directory, enter:
kubectl config view
Clean up
Return your KUBECONFIG environment variable to its original value. For example:
Linux
export KUBECONFIG="$KUBECONFIG_SAVED"
Windows PowerShell
$Env:KUBECONFIG=$ENV:KUBECONFIG_SAVED
Check the subject represented by the kubeconfig
It is not always obvious what attributes (username, groups) you will get after authenticating to the cluster. It can be even more challenging if you are managing more than one cluster at the same time.
There is a kubectl subcommand to check subject attributes, such as username, for your selected Kubernetes
client context: kubectl auth whoami.
Read API access to authentication information for a client to learn about this in more detail.
What's next
4 - Use Port Forwarding to Access Applications in a Cluster
This page shows how to use kubectl port-forward to connect to a MongoDB
server running in a Kubernetes cluster. This type of connection can be useful
for database debugging.
Before you begin
You need to have a Kubernetes cluster, and the kubectl command-line tool must be configured to communicate with your cluster. It is recommended to run this tutorial on a cluster with at least two nodes that are not acting as control plane hosts. If you do not already have a cluster, you can create one by using minikube or you can use one of these Kubernetes playgrounds:
Your Kubernetes server must be at or later than version v1.10.To check the version, enter
kubectl version.- Install MongoDB Shell.
Creating MongoDB deployment and service
Create a Deployment that runs MongoDB:
kubectl apply -f https://k8s.io/examples/application/mongodb/mongo-deployment.yamlThe output of a successful command verifies that the deployment was created:
deployment.apps/mongo createdView the pod status to check that it is ready:
kubectl get podsThe output displays the pod created:
NAME                     READY   STATUS    RESTARTS   AGE
mongo-75f59d57f4-4nd6q   1/1     Running   0          2m4s
View the Deployment's status:
kubectl get deploymentThe output displays that the Deployment was created:
NAME    READY   UP-TO-DATE   AVAILABLE   AGE
mongo   1/1     1            1           2m21s
The Deployment automatically manages a ReplicaSet. View the ReplicaSet status using:
kubectl get replicasetThe output displays that the ReplicaSet was created:
NAME               DESIRED   CURRENT   READY   AGE
mongo-75f59d57f4   1         1         1       3m12s
Create a Service to expose MongoDB on the network:
kubectl apply -f https://k8s.io/examples/application/mongodb/mongo-service.yamlThe output of a successful command verifies that the Service was created:
service/mongo createdCheck the Service created:
kubectl get service mongoThe output displays the service created:
NAME    TYPE        CLUSTER-IP     EXTERNAL-IP   PORT(S)     AGE
mongo   ClusterIP   10.96.41.183   <none>        27017/TCP   11s
Verify that the MongoDB server is running in the Pod, and listening on port 27017:
# Change mongo-75f59d57f4-4nd6q to the name of the Pod
kubectl get pod mongo-75f59d57f4-4nd6q --template='{{(index (index .spec.containers 0).ports 0).containerPort}}{{"\n"}}'
The output displays the port for MongoDB in that Pod:
2701727017 is the official TCP port for MongoDB.
Forward a local port to a port on the Pod
kubectl port-forwardallows using resource name, such as a pod name, to select a matching pod to port forward to.# Change mongo-75f59d57f4-4nd6q to the name of the Pod kubectl port-forward mongo-75f59d57f4-4nd6q 28015:27017which is the same as
kubectl port-forward pods/mongo-75f59d57f4-4nd6q 28015:27017or
kubectl port-forward deployment/mongo 28015:27017or
kubectl port-forward replicaset/mongo-75f59d57f4 28015:27017or
kubectl port-forward service/mongo 28015:27017Any of the above commands works. The output is similar to this:
Forwarding from 127.0.0.1:28015 -> 27017
Forwarding from [::1]:28015 -> 27017
Note:
kubectl port-forwarddoes not return. To continue with the exercises, you will need to open another terminal.Start the MongoDB command line interface:
mongosh --port 28015At the MongoDB command line prompt, enter the
pingcommand:db.runCommand( { ping: 1 } )A successful ping request returns:
{ ok: 1 }
Optionally let kubectl choose the local port
If you don't need a specific local port, you can let kubectl choose and allocate
the local port and thus relieve you from having to manage local port conflicts, with
the slightly simpler syntax:
kubectl port-forward deployment/mongo :27017
The kubectl tool finds a local port number that is not in use (avoiding low ports numbers,
because these might be used by other applications). The output is similar to:
Forwarding from 127.0.0.1:63753 -> 27017
Forwarding from [::1]:63753 -> 27017
Discussion
Connections made to local port 28015 are forwarded to port 27017 of the Pod that is running the MongoDB server. With this connection in place, you can use your local workstation to debug the database that is running in the Pod.
Note:
kubectl port-forward is implemented for TCP ports only.
The support for UDP protocol is tracked in
issue 47862.Authorization and security considerations
Access to kubectl port-forward is controlled by Kubernetes authorization mechanisms like Role-Based Access Control (RBAC). Authorization is enforced by the Kubernetes API server, not by the kubectl client.
To use kubectl port-forward, a user must have permission to access the target resource (for example, a Pod or Service) and the portforward subresource. Typical required permissions include get on pods and create on pods/portforward.
Cluster administrators should carefully restrict these permissions, as port-forwarding can provide direct network access to workloads and may bypass network-level controls.
What's next
Learn more about kubectl port-forward.
5 - Use a Service to Access an Application in a Cluster
This page shows how to create a Kubernetes Service object that external clients can use to access an application running in a cluster. The Service provides load balancing for an application that has two running instances.
Before you begin
You need to have a Kubernetes cluster, and the kubectl command-line tool must be configured to communicate with your cluster. It is recommended to run this tutorial on a cluster with at least two nodes that are not acting as control plane hosts. If you do not already have a cluster, you can create one by using minikube or you can use one of these Kubernetes playgrounds:
Objectives
- Run two instances of a Hello World application.
- Create a Service object that exposes a node port.
- Use the Service object to access the running application.
Creating a service for an application running in two pods
Here is the configuration file for the application Deployment:
apiVersion: apps/v1
kind: Deployment
metadata:
  name: hello-world
spec:
  selector:
    matchLabels:
      run: load-balancer-example
  replicas: 2
  template:
    metadata:
      labels:
        run: load-balancer-example
    spec:
      containers:
        - name: hello-world
          image: us-docker.pkg.dev/google-samples/containers/gke/hello-app:2.0
          ports:
            - containerPort: 8080
              protocol: TCP
Run a Hello World application in your cluster: Create the application Deployment using the file above:
kubectl apply -f https://k8s.io/examples/service/access/hello-application.yamlThe preceding command creates a Deployment and an associated ReplicaSet. The ReplicaSet has two Pods each of which runs the Hello World application.
Display information about the Deployment:
kubectl get deployments hello-world
kubectl describe deployments hello-world
Display information about your ReplicaSet objects:
kubectl get replicasets
kubectl describe replicasets
Create a Service object that exposes the deployment:
kubectl expose deployment hello-world --type=NodePort --name=example-serviceDisplay information about the Service:
kubectl describe services example-serviceThe output is similar to this:
Name:                   example-service
Namespace:              default
Labels:                 run=load-balancer-example
Annotations:            <none>
Selector:               run=load-balancer-example
Type:                   NodePort
IP:                     10.32.0.16
Port:                   <unset> 8080/TCP
TargetPort:             8080/TCP
NodePort:               <unset> 31496/TCP
Endpoints:              10.200.1.4:8080,10.200.2.5:8080
Session Affinity:       None
Events:                 <none>
Make a note of the NodePort value for the Service. For example, in the preceding output, the NodePort value is 31496.
List the pods that are running the Hello World application:
kubectl get pods --selector="run=load-balancer-example" --output=wideThe output is similar to this:
NAME                           READY   STATUS    ...  IP           NODE
hello-world-2895499144-bsbk5   1/1     Running   ...  10.200.1.4   worker1
hello-world-2895499144-m1pwt   1/1     Running   ...  10.200.2.5   worker2
Get the public IP address of one of your nodes that is running a Hello World pod. How you get this address depends on how you set up your cluster. For example, if you are using Minikube, you can see the node address by running
kubectl cluster-info. If you are using Google Compute Engine instances, you can use thegcloud compute instances listcommand to see the public addresses of your nodes.On your chosen node, create a firewall rule that allows TCP traffic on your node port. For example, if your Service has a NodePort value of 31568, create a firewall rule that allows TCP traffic on port 31568. Different cloud providers offer different ways of configuring firewall rules.
Use the node address and node port to access the Hello World application:
curl http://<public-node-ip>:<node-port>where
<public-node-ip>is the public IP address of your node, and<node-port>is the NodePort value for your service. The response to a successful request is a hello message:Hello, world! Version: 2.0.0 Hostname: hello-world-cdd4458f4-m47c8
Using a service configuration file
As an alternative to using kubectl expose, you can use a
service configuration file
to create a Service.
Cleaning up
To delete the Service, enter this command:
kubectl delete services example-service
To delete the Deployment, the ReplicaSet, and the Pods that are running the Hello World application, enter this command:
kubectl delete deployment hello-world
What's next
Follow the Connecting Applications with Services tutorial.
6 - Connect a Frontend to a Backend Using Services
This task shows how to create a frontend and a backend microservice. The backend microservice is a hello greeter. The frontend exposes the backend using nginx and a Kubernetes Service object.
Objectives
- Create and run a sample
hellobackend microservice using a Deployment object. - Use a Service object to send traffic to the backend microservice's multiple replicas.
- Create and run a
nginxfrontend microservice, also using a Deployment object. - Configure the frontend microservice to send traffic to the backend microservice.
- Use a Service object of
type=LoadBalancerto expose the frontend microservice outside the cluster.
Before you begin
You need to have a Kubernetes cluster, and the kubectl command-line tool must be configured to communicate with your cluster. It is recommended to run this tutorial on a cluster with at least two nodes that are not acting as control plane hosts. If you do not already have a cluster, you can create one by using minikube or you can use one of these Kubernetes playgrounds:
To check the version, enter kubectl version.
This task uses Services with external load balancers, which require a supported environment. If your environment does not support this, you can use a Service of type NodePort instead.
Creating the backend using a Deployment
The backend is a simple hello greeter microservice. Here is the configuration file for the backend Deployment:
---
apiVersion: apps/v1
kind: Deployment
metadata:
  name: backend
spec:
  selector:
    matchLabels:
      app: hello
      tier: backend
      track: stable
  replicas: 3
  template:
    metadata:
      labels:
        app: hello
        tier: backend
        track: stable
    spec:
      containers:
        - name: hello
          image: "gcr.io/google-samples/hello-go-gke:1.0"
          ports:
            - name: http
              containerPort: 80
...
Create the backend Deployment:
kubectl apply -f https://k8s.io/examples/service/access/backend-deployment.yaml
View information about the backend Deployment:
kubectl describe deployment backend
The output is similar to this:
Name:                           backend
Namespace:                      default
CreationTimestamp:              Mon, 24 Oct 2016 14:21:02 -0700
Labels:                         app=hello
                                tier=backend
                                track=stable
Annotations:                    deployment.kubernetes.io/revision=1
Selector:                       app=hello,tier=backend,track=stable
Replicas:                       3 desired | 3 updated | 3 total | 3 available | 0 unavailable
StrategyType:                   RollingUpdate
MinReadySeconds:                0
RollingUpdateStrategy:          1 max unavailable, 1 max surge
Pod Template:
  Labels:       app=hello
                tier=backend
                track=stable
  Containers:
   hello:
    Image:              "gcr.io/google-samples/hello-go-gke:1.0"
    Port:               80/TCP
    Environment:        <none>
    Mounts:             <none>
  Volumes:              <none>
Conditions:
  Type          Status  Reason
  ----          ------  ------
  Available     True    MinimumReplicasAvailable
  Progressing   True    NewReplicaSetAvailable
OldReplicaSets:                 <none>
NewReplicaSet:                  hello-3621623197 (3/3 replicas created)
Events:
...
Creating the hello Service object
The key to sending requests from a frontend to a backend is the backend Service. A Service creates a persistent IP address and DNS name entry so that the backend microservice can always be reached. A Service uses selectors to find the Pods that it routes traffic to.
First, explore the Service configuration file:
---
apiVersion: v1
kind: Service
metadata:
  name: hello
spec:
  selector:
    app: hello
    tier: backend
  ports:
  - protocol: TCP
    port: 80
    targetPort: http
...
In the configuration file, you can see that the Service, named hello routes
traffic to Pods that have the labels app: hello and tier: backend.
Create the backend Service:
kubectl apply -f https://k8s.io/examples/service/access/backend-service.yaml
At this point, you have a backend Deployment running three replicas of your hello
application, and you have a Service that can route traffic to them. However, this
service is neither available nor resolvable outside the cluster.
Creating the frontend
Now that you have your backend running, you can create a frontend that is accessible outside the cluster, and connects to the backend by proxying requests to it.
The frontend sends requests to the backend worker Pods by using the DNS name
given to the backend Service. The DNS name is hello, which is the value
of the name field in the examples/service/access/backend-service.yaml
configuration file.
The Pods in the frontend Deployment run a nginx image that is configured
to proxy requests to the hello backend Service. Here is the nginx configuration file:
# The identifier Backend is internal to nginx, and used to name this specific upstream
upstream Backend {
    # hello is the internal DNS name used by the backend Service inside Kubernetes
    server hello;
}
server {
listen 80;
location / {
    # The following statement will proxy traffic to the upstream named Backend
    proxy_pass http://Backend;
}
}
Similar to the backend, the frontend has a Deployment and a Service. An important
difference to notice between the backend and frontend services, is that the
configuration for the frontend Service has type: LoadBalancer, which means that
the Service uses a load balancer provisioned by your cloud provider and will be
accessible from outside the cluster.
---
apiVersion: v1
kind: Service
metadata:
  name: frontend
spec:
  selector:
    app: hello
    tier: frontend
  ports:
  - protocol: "TCP"
    port: 80
    targetPort: 80
  type: LoadBalancer
...---
apiVersion: apps/v1
kind: Deployment
metadata:
name: frontend
spec:
selector:
matchLabels:
app: hello
tier: frontend
track: stable
replicas: 1
template:
metadata:
labels:
app: hello
tier: frontend
track: stable
spec:
containers:
- name: nginx
image: "gcr.io/google-samples/hello-frontend:1.0"
lifecycle:
preStop:
exec:
command: ["/usr/sbin/nginx","-s","quit"]
...Create the frontend Deployment and Service:
kubectl apply -f https://k8s.io/examples/service/access/frontend-deployment.yaml
kubectl apply -f https://k8s.io/examples/service/access/frontend-service.yaml
The output verifies that both resources were created:
deployment.apps/frontend created
service/frontend created
Note:
The nginx configuration is baked into the container image. A better way to do this would be to use a ConfigMap, so that you can change the configuration more easily.Interact with the frontend Service
Once you've created a Service of type LoadBalancer, you can use this command to find the external IP:
kubectl get service frontend --watch
This displays the configuration for the frontend Service and watches for
changes. Initially, the external IP is listed as <pending>:
NAME       TYPE           CLUSTER-IP      EXTERNAL-IP   PORT(S)  AGE
frontend   LoadBalancer   10.51.252.116   <pending>     80/TCP   10s
As soon as an external IP is provisioned, however, the configuration updates
to include the new IP under the EXTERNAL-IP heading:
NAME       TYPE           CLUSTER-IP      EXTERNAL-IP        PORT(S)  AGE
frontend   LoadBalancer   10.51.252.116   XXX.XXX.XXX.XXX    80/TCP   1m
That IP can now be used to interact with the frontend service from outside the
cluster.
Send traffic through the frontend
The frontend and backend are now connected. You can hit the endpoint by using the curl command on the external IP of your frontend Service.
curl http://${EXTERNAL_IP} # replace this with the EXTERNAL-IP you saw earlier
The output shows the message generated by the backend:
{"message":"Hello"}
Cleaning up
To delete the Services, enter this command:
kubectl delete services frontend backend
To delete the Deployments, the ReplicaSets and the Pods that are running the backend and frontend applications, enter this command:
kubectl delete deployment frontend backend
What's next
- Learn more about Services
- Learn more about ConfigMaps
- Learn more about DNS for Service and Pods
7 - Create an External Load Balancer
This page shows how to create an external load balancer.
When creating a Service, you have the option of automatically creating a cloud load balancer. This provides an externally-accessible IP address that sends traffic to the correct port on your cluster nodes, provided your cluster runs in a supported environment and is configured with the correct cloud load balancer provider package.
You can also use an Ingress in place of Service. For more information, check the Ingress documentation.
Before you begin
You need to have a Kubernetes cluster, and the kubectl command-line tool must be configured to communicate with your cluster. It is recommended to run this tutorial on a cluster with at least two nodes that are not acting as control plane hosts. If you do not already have a cluster, you can create one by using minikube or you can use one of these Kubernetes playgrounds:
Your cluster must be running in a cloud or other environment that already has support for configuring external load balancers.
Create a Service
Create a Service from a manifest
To create an external load balancer, add the following line to your Service manifest:
type: LoadBalancer
Your manifest might then look like:
apiVersion: v1
kind: Service
metadata:
  name: example-service
spec:
  selector:
    app: example
  ports:
    - port: 8765
      targetPort: 9376
  type: LoadBalancer
Create a Service using kubectl
You can alternatively create the service with the kubectl expose command and
its --type=LoadBalancer flag:
kubectl expose deployment example --port=8765 --target-port=9376 \
        --name=example-service --type=LoadBalancer
This command creates a new Service using the same selectors as the referenced
resource (in the case of the example above, a
Deployment named example).
For more information, including optional flags, refer to the
kubectl expose reference.
Finding your IP address
You can find the IP address created for your service by getting the service
information through kubectl:
kubectl describe services example-service
which should produce output similar to:
Name:                     example-service
Namespace:                default
Labels:                   app=example
Annotations:              <none>
Selector:                 app=example
Type:                     LoadBalancer
IP Families:              <none>
IP:                       10.3.22.96
IPs:                      10.3.22.96
LoadBalancer Ingress:     192.0.2.89
Port:                     <unset>  8765/TCP
TargetPort:               9376/TCP
NodePort:                 <unset>  30593/TCP
Endpoints:                172.17.0.3:9376
Session Affinity:         None
External Traffic Policy:  Cluster
Events:                   <none>
The load balancer's IP address is listed next to LoadBalancer Ingress.
Note:
If you are running your service on Minikube, you can find the assigned IP address and port with:
minikube service example-service --url
Preserving the client source IP
By default, the source IP seen in the target container is not the original
source IP of the client. To enable preservation of the client IP, the following
fields can be configured in the .spec of the Service:
.spec.externalTrafficPolicy- denotes if this Service desires to route external traffic to node-local or cluster-wide endpoints. There are two available options:Cluster(default) andLocal.Clusterobscures the client source IP and may cause a second hop to another node, but should have good overall load-spreading.Localpreserves the client source IP and avoids a second hop for LoadBalancer and NodePort type Services, but risks potentially imbalanced traffic spreading..spec.healthCheckNodePort- specifies the health check node port (numeric port number) for the service. If you don't specifyhealthCheckNodePort, the service controller allocates a port from your cluster's NodePort range.
You can configure that range by setting an API server command line option,--service-node-port-range. The Service will use the user-specifiedhealthCheckNodePortvalue if you specify it, provided that the Servicetypeis set to LoadBalancer andexternalTrafficPolicyis set toLocal.
Setting externalTrafficPolicy to Local in the Service manifest
activates this feature. For example:
apiVersion: v1
kind: Service
metadata:
  name: example-service
spec:
  selector:
    app: example
  ports:
    - port: 8765
      targetPort: 9376
  externalTrafficPolicy: Local
  type: LoadBalancer
Caveats and limitations when preserving source IPs
Load balancing services from some cloud providers do not let you configure different weights for each target.
With each target weighted equally in terms of sending traffic to Nodes, external traffic is not equally load balanced across different Pods. The external load balancer is unaware of the number of Pods on each node that are used as a target.
Where NumServicePods << NumNodes or NumServicePods >> NumNodes, a fairly close-to-equal
distribution will be seen, even without weights.
Internal pod to pod traffic should behave similar to ClusterIP services, with equal probability across all pods.
Garbage collecting load balancers
Kubernetes v1.17 [stable]In usual case, the correlating load balancer resources in cloud provider should be cleaned up soon after a LoadBalancer type Service is deleted. But it is known that there are various corner cases where cloud resources are orphaned after the associated Service is deleted. Finalizer Protection for Service LoadBalancers was introduced to prevent this from happening. By using finalizers, a Service resource will never be deleted until the correlating load balancer resources are also deleted.
Specifically, if a Service has type LoadBalancer, the service controller will attach
a finalizer named service.kubernetes.io/load-balancer-cleanup.
The finalizer will only be removed after the load balancer resource is cleaned up.
This prevents dangling load balancer resources even in corner cases such as the
service controller crashing.
External load balancer providers
It is important to note that the datapath for this functionality is provided by a load balancer external to the Kubernetes cluster.
When the Service type is set to LoadBalancer, Kubernetes provides functionality equivalent to type equals ClusterIP to pods
within the cluster and extends it by programming the (external to Kubernetes) load balancer with entries for the nodes
hosting the relevant Kubernetes pods. The Kubernetes control plane automates the creation of the external load balancer,
health checks (if needed), and packet filtering rules (if needed). Once the cloud provider allocates an IP address for the load
balancer, the control plane looks up that external IP address and populates it into the Service object.
What's next
- Follow the Connecting Applications with Services tutorial
- Read about Service
- Read about Ingress
8 - List All Container Images Running in a Cluster
This page shows how to use kubectl to list all of the Container images for Pods running in a cluster.
Before you begin
You need to have a Kubernetes cluster, and the kubectl command-line tool must be configured to communicate with your cluster. It is recommended to run this tutorial on a cluster with at least two nodes that are not acting as control plane hosts. If you do not already have a cluster, you can create one by using minikube or you can use one of these Kubernetes playgrounds:
To check the version, enter kubectl version.
In this exercise you will use kubectl to fetch all of the Pods running in a cluster, and format the output to pull out the list of Containers for each.
List all Container images in all namespaces
- Fetch all Pods in all namespaces using
kubectl get pods --all-namespaces - Format the output to include only the list of Container image names
using
-o jsonpath={.items[*].spec['initContainers', 'containers'][*].image}. This will recursively parse out theimagefield from the returned json.- See the jsonpath reference for further information on how to use jsonpath.
- Format the output using standard tools:
tr,sort,uniq- Use
trto replace spaces with newlines - Use
sortto sort the results - Use
uniqto aggregate image counts
- Use
kubectl get pods --all-namespaces -o jsonpath="{.items[*].spec['initContainers', 'containers'][*].image}" |\
tr -s '[[:space:]]' '\n' |\
sort |\
uniq -c
The jsonpath is interpreted as follows:
.items[*]: for each returned value.spec: get the spec['initContainers', 'containers'][*]: for each container.image: get the image
Note:
When fetching a single Pod by name, for examplekubectl get pod nginx,
the .items[*] portion of the path should be omitted because a single
Pod is returned instead of a list of items.List Container images by Pod
The formatting can be controlled further by using the range operation to
iterate over elements individually.
kubectl get pods --all-namespaces -o jsonpath='{range .items[*]}{"\n"}{.metadata.name}{":\t"}{range .spec.containers[*]}{.image}{", "}{end}{end}' |\
sort
List Container images filtering by Pod label
To target only Pods matching a specific label, use the -l flag. The
following matches only Pods with labels matching app=nginx.
kubectl get pods --all-namespaces -o jsonpath="{.items[*].spec.containers[*].image}" -l app=nginx
List Container images filtering by Pod namespace
To target only pods in a specific namespace, use the namespace flag. The
following matches only Pods in the kube-system namespace.
kubectl get pods --namespace kube-system -o jsonpath="{.items[*].spec.containers[*].image}"
List Container images using a go-template instead of jsonpath
As an alternative to jsonpath, Kubectl supports using go-templates for formatting the output:
kubectl get pods --all-namespaces -o go-template --template="{{range .items}}{{range .spec.containers}}{{.image}} {{end}}{{end}}"
What's next
Reference
- Jsonpath reference guide
- Go template reference guide
9 - Communicate Between Containers in the Same Pod Using a Shared Volume
This page shows how to use a Volume to communicate between two Containers running in the same Pod. See also how to allow processes to communicate by sharing process namespace between containers.
Before you begin
You need to have a Kubernetes cluster, and the kubectl command-line tool must be configured to communicate with your cluster. It is recommended to run this tutorial on a cluster with at least two nodes that are not acting as control plane hosts. If you do not already have a cluster, you can create one by using minikube or you can use one of these Kubernetes playgrounds:
To check the version, enter kubectl version.
Creating a Pod that runs two Containers
In this exercise, you create a Pod that runs two Containers. The two containers share a Volume that they can use to communicate. Here is the configuration file for the Pod:
apiVersion: v1
kind: Pod
metadata:
  name: two-containers
spec:

  restartPolicy: Never

  volumes:
  - name: shared-data
    emptyDir: {}

  containers:

  - name: nginx-container
    image: nginx
    volumeMounts:
    - name: shared-data
      mountPath: /usr/share/nginx/html

  - name: debian-container
    image: debian
    volumeMounts:
    - name: shared-data
      mountPath: /pod-data
    command: ["/bin/sh"]
    args: ["-c", "echo Hello from the debian container > /pod-data/index.html"]
In the configuration file, you can see that the Pod has a Volume named
shared-data.
The first container listed in the configuration file runs an nginx server. The
mount path for the shared Volume is /usr/share/nginx/html.
The second container is based on the debian image, and has a mount path of
/pod-data. The second container runs the following command and then terminates.
echo Hello from the debian container > /pod-data/index.html
Notice that the second container writes the index.html file in the root
directory of the nginx server.
Create the Pod and the two Containers:
kubectl apply -f https://k8s.io/examples/pods/two-container-pod.yaml
View information about the Pod and the Containers:
kubectl get pod two-containers --output=yaml
Here is a portion of the output:
apiVersion: v1
kind: Pod
metadata:
  ...
  name: two-containers
  namespace: default
  ...
spec:
  ...
  containerStatuses:

  - containerID: docker://c1d8abd1 ...
    image: debian
    ...
    lastState:
      terminated:
        ...
    name: debian-container
    ...

  - containerID: docker://96c1ff2c5bb ...
    image: nginx
    ...
    name: nginx-container
    ...
    state:
      running:
    ...
You can see that the debian Container has terminated, and the nginx Container is still running.
Get a shell to nginx Container:
kubectl exec -it two-containers -c nginx-container -- /bin/bash
In your shell, verify that nginx is running:
root@two-containers:/# apt-get update
root@two-containers:/# apt-get install curl procps
root@two-containers:/# ps aux
The output is similar to this:
USER       PID  ...  STAT START   TIME COMMAND
root         1  ...  Ss   21:12   0:00 nginx: master process nginx -g daemon off;
Recall that the debian Container created the index.html file in the nginx root
directory. Use curl to send a GET request to the nginx server:
root@two-containers:/# curl localhost
The output shows that nginx serves a web page written by the debian container:
Hello from the debian container
Discussion
The primary reason that Pods can have multiple containers is to support helper applications that assist a primary application. Typical examples of helper applications are data pullers, data pushers, and proxies. Helper and primary applications often need to communicate with each other. Typically this is done through a shared filesystem, as shown in this exercise, or through the loopback network interface, localhost. An example of this pattern is a web server along with a helper program that polls a Git repository for new updates.
The Volume in this exercise provides a way for Containers to communicate during the life of the Pod. If the Pod is deleted and recreated, any data stored in the shared Volume is lost.
What's next
10 - Configure DNS for a Cluster
Kubernetes offers a DNS cluster addon, which most of the supported environments enable by default. In Kubernetes version 1.11 and later, CoreDNS is recommended and is installed by default with kubeadm.
For more information on how to configure CoreDNS for a Kubernetes cluster, see the Customizing DNS Service.
11 - Access Services Running on Clusters
This page shows how to connect to services running on the Kubernetes cluster.
Before you begin
You need to have a Kubernetes cluster, and the kubectl command-line tool must be configured to communicate with your cluster. It is recommended to run this tutorial on a cluster with at least two nodes that are not acting as control plane hosts. If you do not already have a cluster, you can create one by using minikube or you can use one of these Kubernetes playgrounds:
To check the version, enter kubectl version.
Accessing services running on the cluster
In Kubernetes, nodes, pods and services all have their own IPs. In many cases, the node IPs, pod IPs, and some service IPs on a cluster will not be routable, so they will not be reachable from a machine outside the cluster, such as your desktop machine.
Ways to connect
You have several options for connecting to nodes, pods and services from outside the cluster:
- Access services through public IPs.
- Use a service with type
NodePortorLoadBalancerto make the service reachable outside the cluster. See the services and kubectl expose documentation. - Depending on your cluster environment, this may only expose the service to your corporate network, or it may expose it to the internet. Think about whether the service being exposed is secure. Does it do its own authentication?
- Place pods behind services. To access one specific pod from a set of replicas, such as for debugging, place a unique label on the pod and create a new service which selects this label.
- In most cases, it should not be necessary for application developer to directly access nodes via their nodeIPs.
- Use a service with type
- Access services, nodes, or pods using the Proxy Verb.
- Does apiserver authentication and authorization prior to accessing the remote service. Use this if the services are not secure enough to expose to the internet, or to gain access to ports on the node IP, or for debugging.
- Proxies may cause problems for some web applications.
- Only works for HTTP/HTTPS.
- Described here.
- Access from a node or pod in the cluster.
- Run a pod, and then connect to a shell in it using kubectl exec. Connect to other nodes, pods, and services from that shell.
- Some clusters may allow you to ssh to a node in the cluster. From there you may be able to access cluster services. This is a non-standard method, and will work on some clusters but not others. Browsers and other tools may or may not be installed. Cluster DNS may not work.
Discovering builtin services
Typically, there are several services which are started on a cluster by kube-system. Get a list of these
with the kubectl cluster-info command:
kubectl cluster-info
The output is similar to this:
Kubernetes master is running at https://192.0.2.1
elasticsearch-logging is running at https://192.0.2.1/api/v1/namespaces/kube-system/services/elasticsearch-logging/proxy
kibana-logging is running at https://192.0.2.1/api/v1/namespaces/kube-system/services/kibana-logging/proxy
kube-dns is running at https://192.0.2.1/api/v1/namespaces/kube-system/services/kube-dns/proxy
grafana is running at https://192.0.2.1/api/v1/namespaces/kube-system/services/monitoring-grafana/proxy
heapster is running at https://192.0.2.1/api/v1/namespaces/kube-system/services/monitoring-heapster/proxy
This shows the proxy-verb URL for accessing each service.
For example, this cluster has cluster-level logging enabled (using Elasticsearch), which can be reached
at https://192.0.2.1/api/v1/namespaces/kube-system/services/elasticsearch-logging/proxy/
if suitable credentials are passed, or through a kubectl proxy at, for example:
http://localhost:8080/api/v1/namespaces/kube-system/services/elasticsearch-logging/proxy/.
Note:
See Access Clusters Using the Kubernetes API for how to pass credentials or use kubectl proxy.Manually constructing apiserver proxy URLs
As mentioned above, you use the kubectl cluster-info command to retrieve the service's proxy URL. To create
proxy URLs that include service endpoints, suffixes, and parameters, you append to the service's proxy URL:
http://kubernetes_master_address/api/v1/namespaces/namespace_name/services/[https:]service_name[:port_name]/proxy
If you haven't specified a name for your port, you don't have to specify port_name in the URL. You can also use the port number in place of the port_name for both named and unnamed ports.
By default, the API server proxies to your service using HTTP. To use HTTPS, prefix the service name with https::
http://<kubernetes_master_address>/api/v1/namespaces/<namespace_name>/services/<service_name>/proxy
The supported formats for the <service_name> segment of the URL are:
<service_name>- proxies to the default or unnamed port using http<service_name>:<port_name>- proxies to the specified port name or port number using httphttps:<service_name>:- proxies to the default or unnamed port using https (note the trailing colon)https:<service_name>:<port_name>- proxies to the specified port name or port number using https
Examples
To access the Elasticsearch service endpoint
_search?q=user:kimchy, you would use:http://192.0.2.1/api/v1/namespaces/kube-system/services/elasticsearch-logging/proxy/_search?q=user:kimchyTo access the Elasticsearch cluster health information
_cluster/health?pretty=true, you would use:https://192.0.2.1/api/v1/namespaces/kube-system/services/elasticsearch-logging/proxy/_cluster/health?pretty=trueThe health information is similar to this:
{
  "cluster_name" : "kubernetes_logging",
  "status" : "yellow",
  "timed_out" : false,
  "number_of_nodes" : 1,
  "number_of_data_nodes" : 1,
  "active_primary_shards" : 5,
  "active_shards" : 5,
  "relocating_shards" : 0,
  "initializing_shards" : 0,
  "unassigned_shards" : 5
}
To access the https Elasticsearch service health information
_cluster/health?pretty=true, you would use:https://192.0.2.1/api/v1/namespaces/kube-system/services/https:elasticsearch-logging:/proxy/_cluster/health?pretty=true
Using web browsers to access services running on the cluster
You may be able to put an apiserver proxy URL into the address bar of a browser. However:
- Web browsers cannot usually pass tokens, so you may need to use basic (password) auth. Apiserver can be configured to accept basic auth, but your cluster may not be configured to accept basic auth.
- Some web apps may not work, particularly those with client side javascript that construct URLs in a way that is unaware of the proxy path prefix.